Note:
Only the Insights Admin user can remove these out-of-the-box dashboards from any user's default OOTB folder. Individual users may not delete dashboards shared with them.
Processes Dashboard

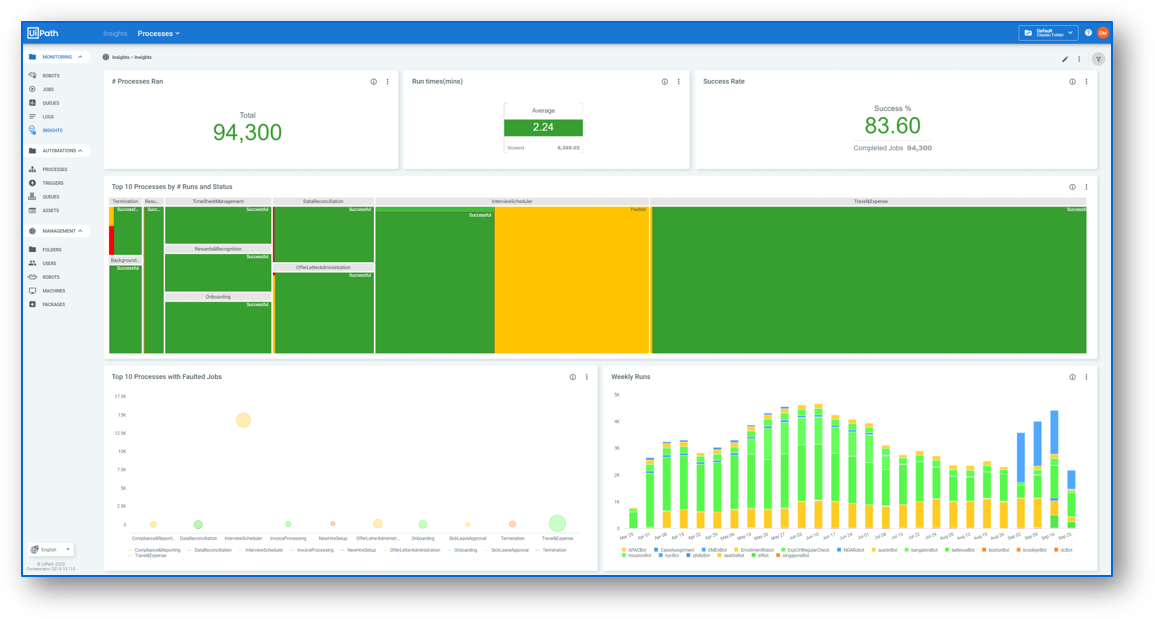
By default, the Processes dashboard is comprised of the following widgets, which can be edited:
| Widget Name | Widget Type | Description |
|---|---|---|
| # Processes Ran | Input | Cumulative total of all processes executed. |
| Run time | Input | Displays the average job duration and the single longest job duration in seconds to minutes. |
| Success Rate | Input | Displays the percentage of jobs with state successful and the total number of completed jobs. |
| Top 10 Processes by # Run and Status | Tree Map | Displays each process by name, split by the number and status of all jobs for that process. |
| Top 10 Processes with Faulted Jobs | Scatter Chart | Displays the top 10 processes with the most faulted jobs. |
| Weekly Runs | Column Chart | The number of execution per week for each robot. |
| Error Details | Pivot | Displays the Process Name, Robot Name, Date, Reason, and # Errors for analysis. |
Robots Dashboard

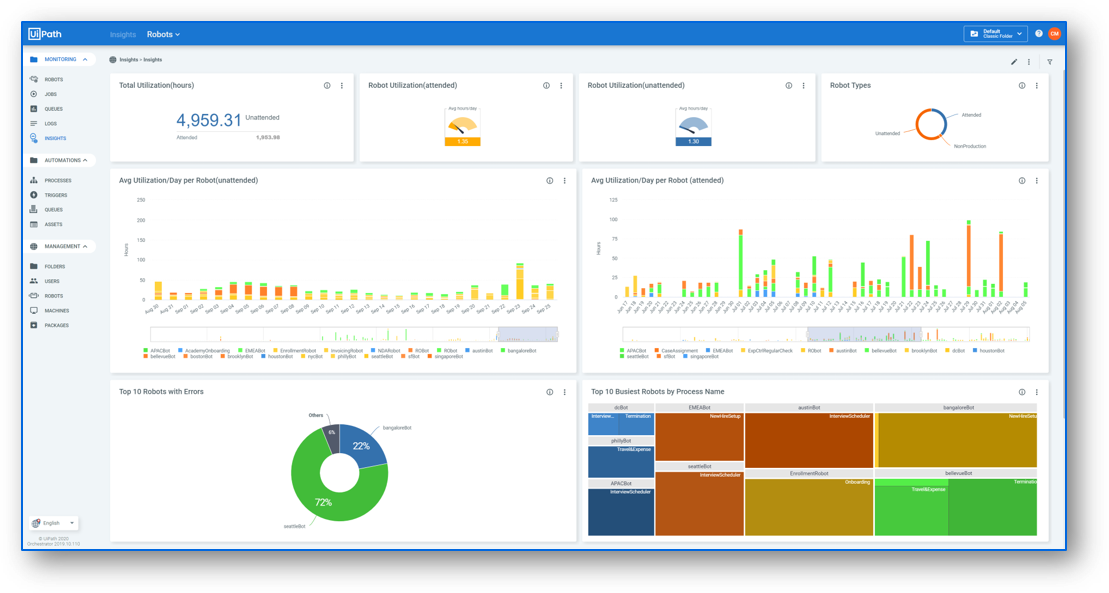
By default, the Robots dashboard is comprised of the following widgets, which can be edited:
| Widget Name | Widget Type | Description |
|---|---|---|
| Total Utilization | Input | The total utilization, in hours, for both attended and unattended robots. |
| Robot Utilization(attended) | Input | Average utilization in hours per day for attended robots. |
| Robot Utilization(unattended) | Input | Average utilization in hours per day for unattended robots. |
| Robot Types | Pie Chart | The types of robots from which data was received in Insights. |
| Avg Utilization/Day per Robot(unattended) | Column Chart | Average hours worked per day, for each unattended robot. |
| Avg Utilization/Day per Robot(attended) | Column Chart | Average hours worked per day, for each attended robot. |
| Top 10 Robots with Errors | Pie Chart | The ten robots with the most errors. |
| Top 10 Busiest Robots by Process Name | Tree Map | The robots that spent the most time executing each process. |
| Today's Utilization Breakdown | Gantt Chart | Displays the time each robot worked over the previous 24 hours. |
Business ROI Dashboard

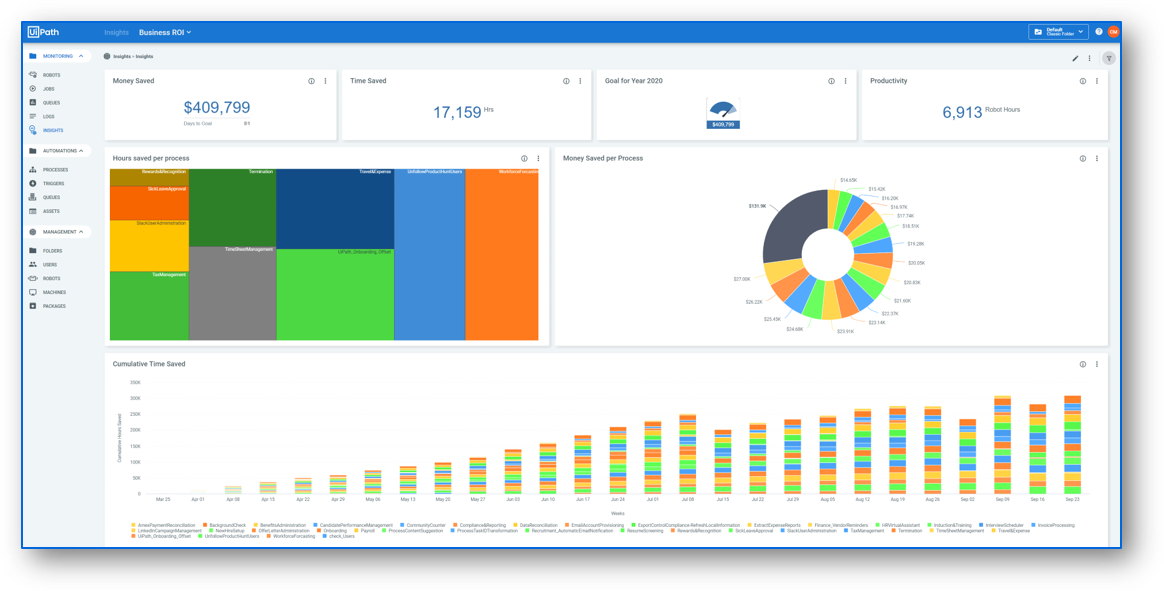
By default, the Business ROI dashboard is comprised of the following widgets, which can be edited:
| Widget Name | Widget Type | Description |
|---|---|---|
| Money Saved | Input | Displays the current total of money saved based upon the valued entered in the Process Baselines widget, as well as the days until your defined goal is reached at the current rate. |
| Time Saved | Input | Displays the current total time saved based upon the Manual Time value entered in the Process Baselines widget. |
| Goal for Year 2020 | Input | Static display of your defined goal value. This widget must be manually defined. |
| Productivity | Input | The total hours worked by all robots to date. |
| Hours Saved per Process | Tree Map | Breakdown of the time saved per process to date, based upon the Manual Time value entered in the Process Baselines widget.Displays the Top 10 according to this calculation. |
| Money Saved per Process | Pie Chart | Breakdown of the money saved per process to date, based upon the values entered in the Process Baselines widget. |
| Cumulative Time Saved | Column Chart | Total time saved for each week, with a breakdown per process. |
| Process Baselines | Input | Used to manually input: The manual time for a human to complete one iteration of a process. The hourly cost for human completion of a process. These values are used to compute the time and money savings throughout the dashboard. |
Queues Dashboard

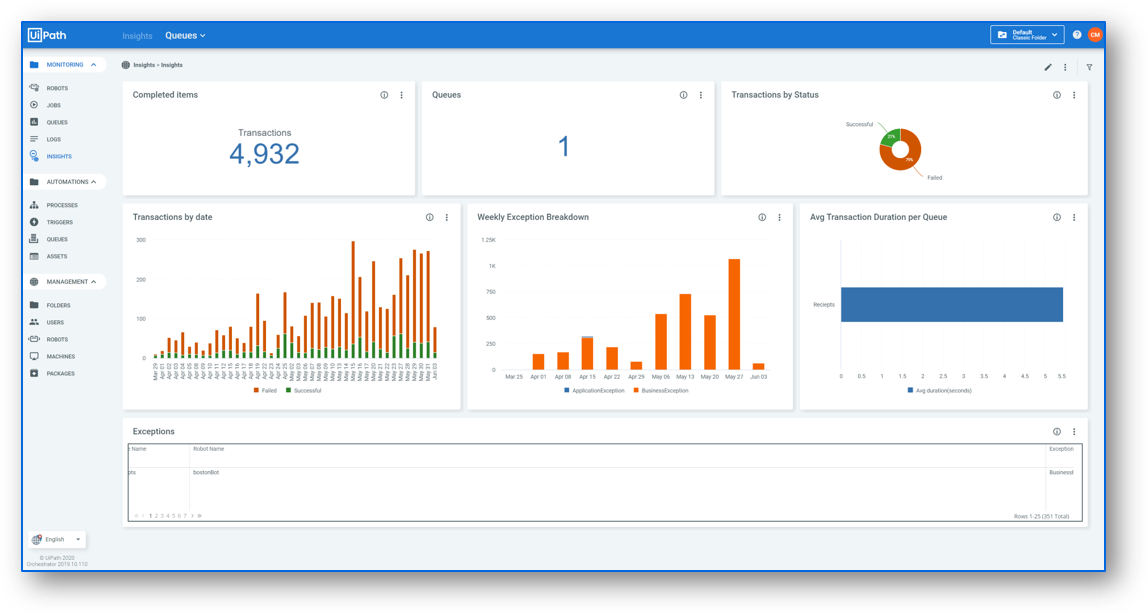
By default, the Queues dashboard is comprised of the following widgets, which can be edited:
| Widget Name | Widget Type | Description |
|---|---|---|
| Completed Items | Input | Displays a cumulative total of all transactions processed to date. |
| Queues | Input | The total number of queues. |
| Transactions by Status | Pie Chart | The total number of transactions, including retried transactions, for each state: Successful Abandoned Failed |
| Transactions by Date | Column Chart | The total number of transactions per day, with a breakdown by Successful and Failed status. |
| Weekly Exception Breakdown | Column Chart | Total number of exceptions for each week, with a breakdown by exception type: ApplicationException or BusinessException. |
| Avg Transaction Duration Per Queue | Bar Chart | Displays the average handling time, in seconds, for each item per queue. |
| Exceptions | Pivot | Pivot table displaying the Queue Name, Robot Name, Exception Type, Reason, and # Errors for analysis. |
Updated 2 years ago