Important!
Remember to save your work frequently when working in the Insights Portal as it will be lost if your Orchestrator session expires while you are doing so.
The timeout of your Orchestrator session can be modified using theAuth.Cookie.Expireparameter in the Orchestratorweb.configfile.
Dashboards are created and edited from the Analytics tab of the Insights Portal.
Note:
If you are creating and editing dashboards on a low-resolution display, you may need to zoom out to see the full range of controls(i.e the Create and Cancel buttons).
Creating Dashboards
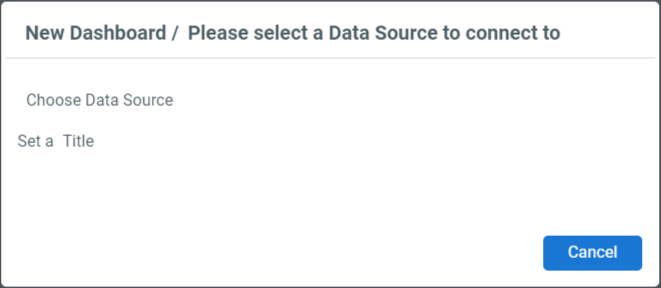
- Click the To Create Your Dashboard tile or select New Dashboard from the Options menu of the Dashboards pane. The New Dashboard window appears.
- Click the Choose Data Source field and select the cube with your Orchestrator tenant name as the data source for the new dashboard.
- In the Set a Title field, enter a descriptive name. By default, this field is pre-filled with the data source name.
- Click Create. The new dashboard is created and appears as a tile in the Analytics tab.
Editing Dashboards
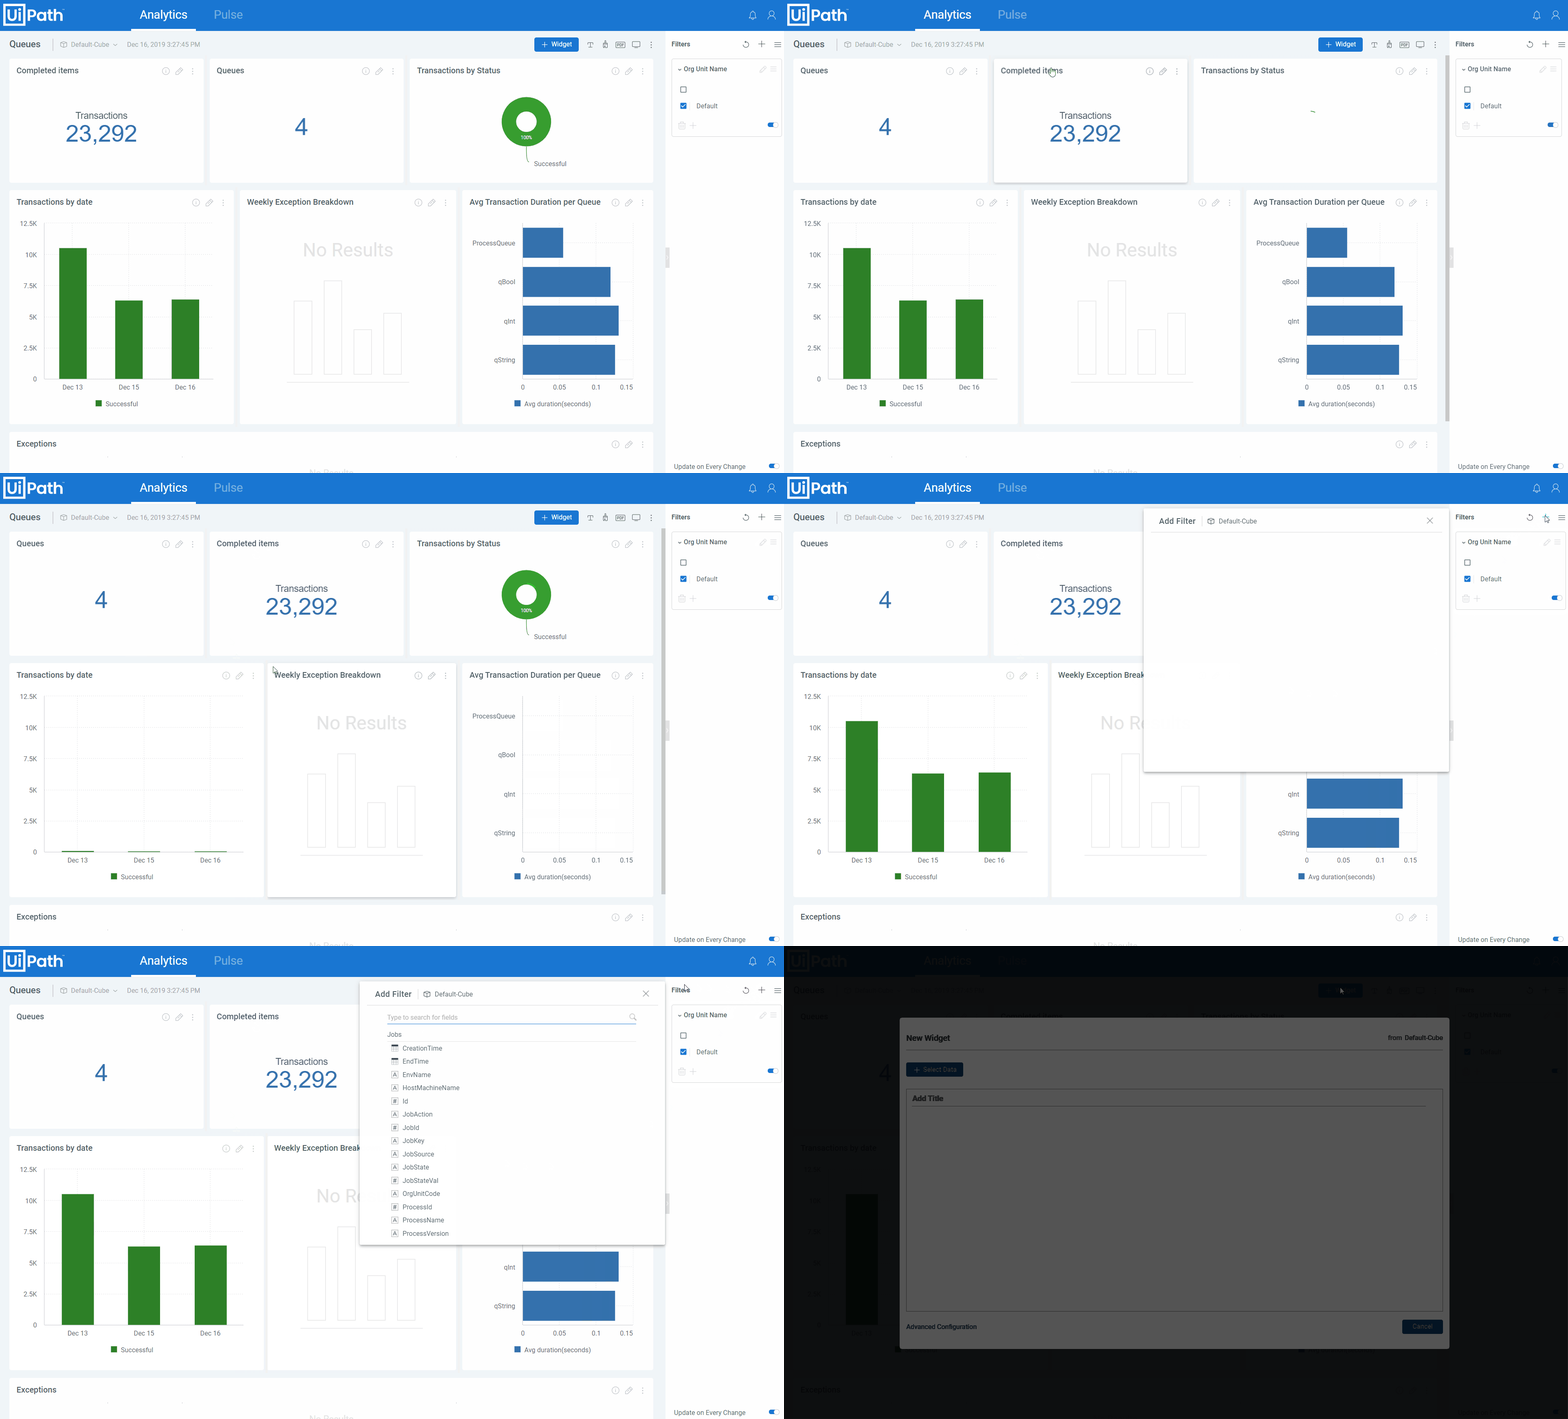
Viewing a dashboard in the Insights Portal enables you to edit that dashboard in Design Mode. From here you add, remove, or edit any widgets and filters, reorganize current widgets, and resize the columns.
Note:
You must republish the dashboard after editing it in order for users you have shared it with to see the changes. See here for details.
Duplicating Dashboards
You can create a duplicate of any existing dashboard by using the More Options menu, either in the tile view or from the Dashboards pane, and selecting Duplicate.
A copy of the selected dashboard is created and appears in the tile view and Dashboards pane. This copy is completely separate and can be edited without any impact to the original dashboard.
Exporting Dashboards
Note:
The exported dashboard file may contain sensitive information.
You can export any or all dashboards by using the More Options menu of a dashboard's tile or the Select Dashboards button of the Dashboards pane and selecting Export. The selected dashboards are downloaded locally as .dash files.
Deleting Dashboards
Dashboards can be deleted individually from the More Options menu of any particular dashboard, or in bulk by using the Select Dashboards button in the Dashboards pane. When selected, a blank check box appears next to all existing dashboards. Select those dashboards you want to delete and then click the Delete button.
Organizing Dashboards
When working with large numbers of dashboards it is best to keep them organized for easy navigation by creating folders, and sub-folders, to suit your needs. You can do this from the Dashboards pane of the Analytics tab.
Creating Folders
To create a folder, click the Options (+) button and select New Folder. A new folder appears in the pane with an editable name.
To create a sub-folder, click the More Options button of any existing folder and select New Folder.
You can then drag-and-drop existing dashboards into the folder, or create a new dashboard directly in that folder from the More Options menu.
Deleting Folders
Folders can be deleted individually from the More Options menu of any particular folder, or in bulk by using the Select Dashboards button in the Dashboards pane. When selected, a blank check box appears next to all existing folders and dashboards. Select those folders (or dashboards) you want to delete and then click the Delete button.
Generating PDF Reports
From the dashboard view in the Analytics tab you can create a .pdf report of your dashboard. You can download the report directly, or save the desired settings that will be used when anyone you have shared the dashboard with downloads or receives the scheduled email report.
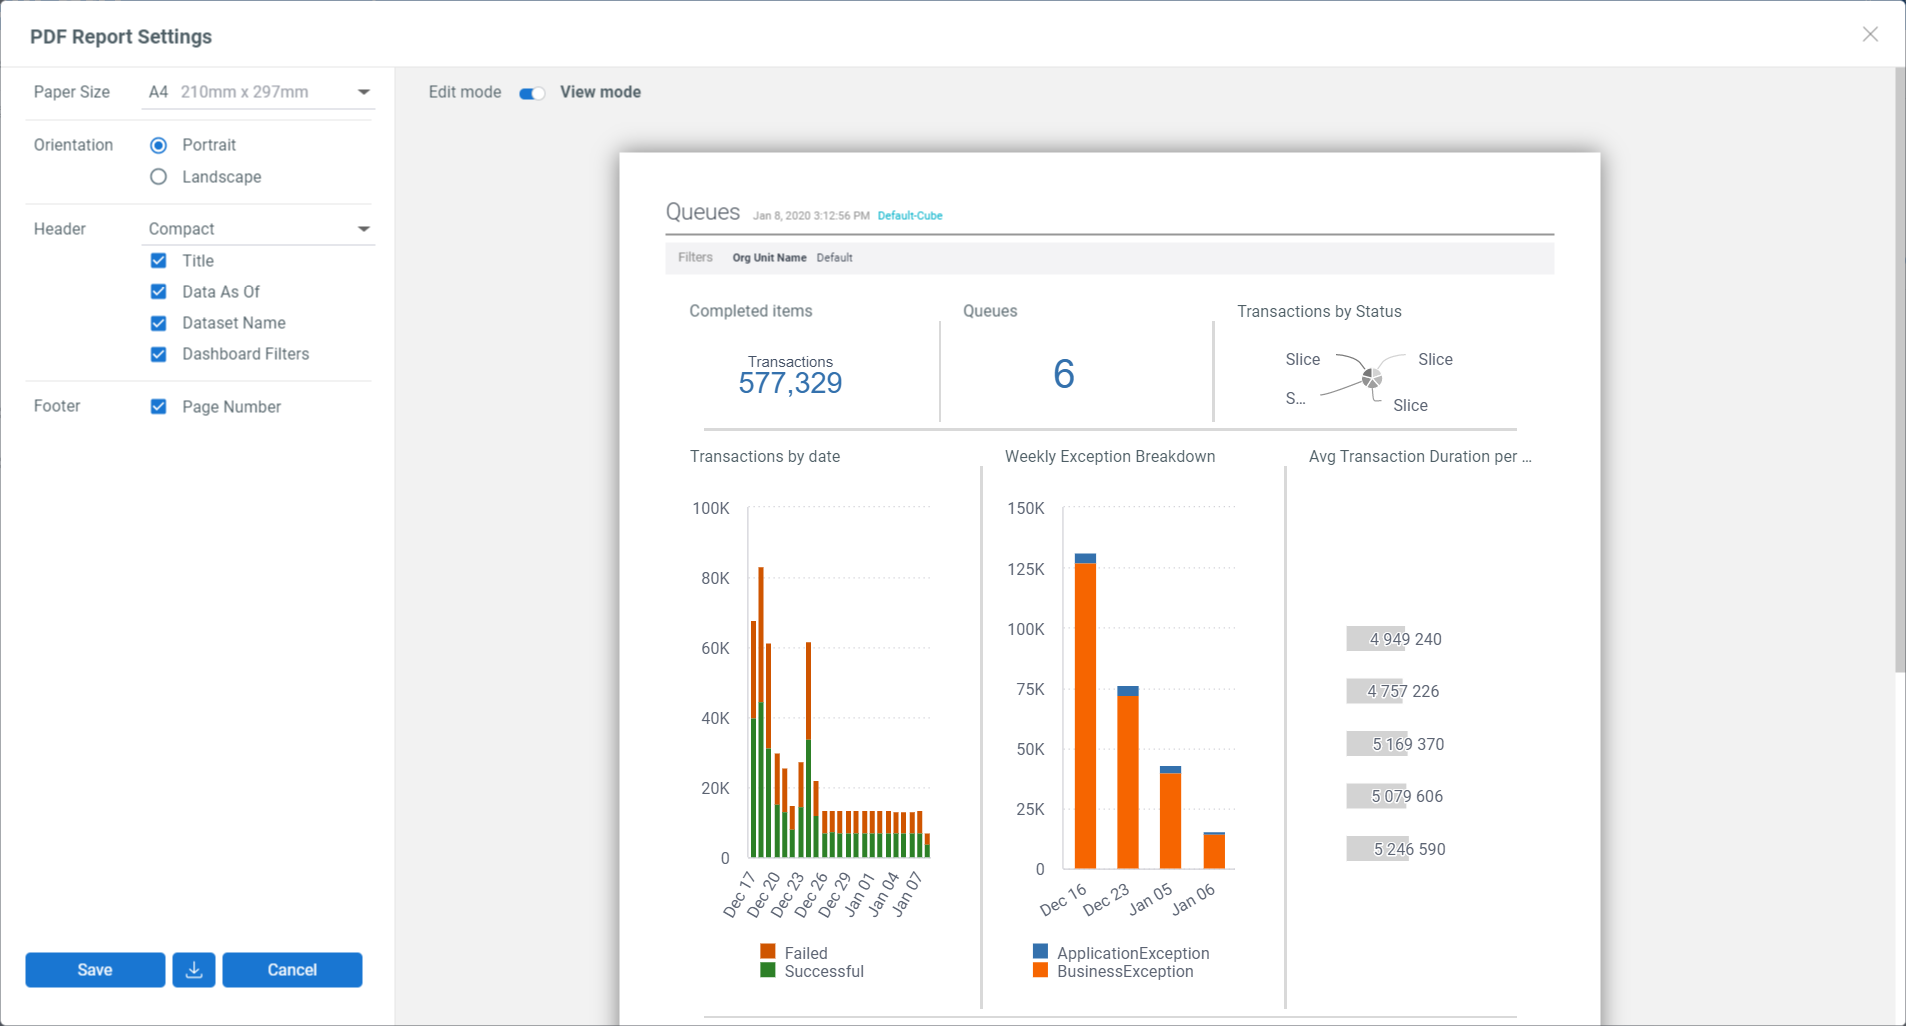
- Click the Configure PDF report settings button from the dashboard heading. The PDF Report Settings window is displayed.
- From the Paper Size drop-down select the desired size of your report.
- In the Orientation field, use the radio buttons to select whether the report is displayed in Portrait or Landscape
- From the Header field, use the drop-down to select the size of your header, and the checkboxes to select what options are displayed there:
- Title - indicates if the dashboard name is displayed.
- Date As Of - indicate whether the date and time of the last data update is displayed.
- Dataset Name - indicate whether the name of the data cube is displayed.
- Dashboard Filters - indicate whether the filters applied to the current dashboard view are displayed.
- In the Footer field, use the checkbox to indicate if the Page Number is displayed.
- In the preview panel, use the toggle to select:
- Edit mode - enables you to resize and reposition the columns of the dashboard view.
- View mode - displays the report as it will be presented.
- Click Save to save and apply these settings or Download to download a copy of the report as configured.
Updated 2 years ago


