Logs are time-stamped files which contain informational events, error and warning messages relevant to the application.
If Orchestrator is unavailable, logs are stored in a local database (C:\Windows\SysWOW64\config\systemprofile\AppData\Local\UiPath\Logs\execution_log_data), within the available disk space, until the connection is restored. When the connection is restored, the logs are sent in batches in the order they had been generated.
Note
The database is not deleted after the logs have been successfully sent to Orchestrator.
The status of a job is stored in the memory of the UiPath Robot service. When Orchestrator becomes available, the information regarding the job status is synced between the two. However, if Orchestrator is not available and you restart the UiPath Robot service, the information is lost. This means that whenever Orchestrator becomes available the job is executed again.
Robot Diagnostic Logs
These logs provide information related to the Robot itself and its context. They are useful in identifying the cause of a specific error.
Enabling Robot Diagnostic Logs
By default, Robot Diagnostic logs are enabled and any message with the Error or Warning levels is logged.
If other levels of logging information are needed, all of them can be enabled if Low Level Tracing is enabled. By default, this feature is disabled.
To enable Low Level Tracing, run the following command UiRobot.exe --enableLowLevel in Command Prompt.
To disable Low Level Tracing, run the following command UiRobot.exe --disableLowLevel in Command Prompt.
Enabling Low Level Tracing as an administrator, local, or domain user starts low level tracing for the .etl file. This enables verbose tracing for the Robot Executor and Service in the Event Viewer.
Don't forget to first go to the installation directory by using the cd argument, such as cd C:\Program Files (x86)\UiPath\Studio.
Note:
We recommend enabling Low Level Tracing only while investigating a problem, and disabling it when the investigation session is over.
Additionally, the.etlfile containing the trace information is generated only after you disable the feature.
The Robot doesn’t need to be restarted for the changes to take effect.
Targets of the Robot Diagnostic Logs
The target location of the logs is controlled by the <Installation Folder>\NLog.config file. The Diagnostic logs are collected by the Internal type logger and are forwarded by using NLog targets.
By default, Internal logs are sent to Event Viewer, as specified in the following lines from NLog.config:
<target xsi:type="EventLog" name="eventLog" layout="${callsite:className=false:includeSourcePath=true:methodName=false} ${message}" source="UiPath" log="Application" />
<logger name="Internal" minLevel="Trace" writeTo="eventLog" />
Note:
Editing the
NLog.configfile requires administrator permissions. The UiRobot.exe service needs to be restarted if the Internal target is changed in theNLog.configfile for the changes to take effect.
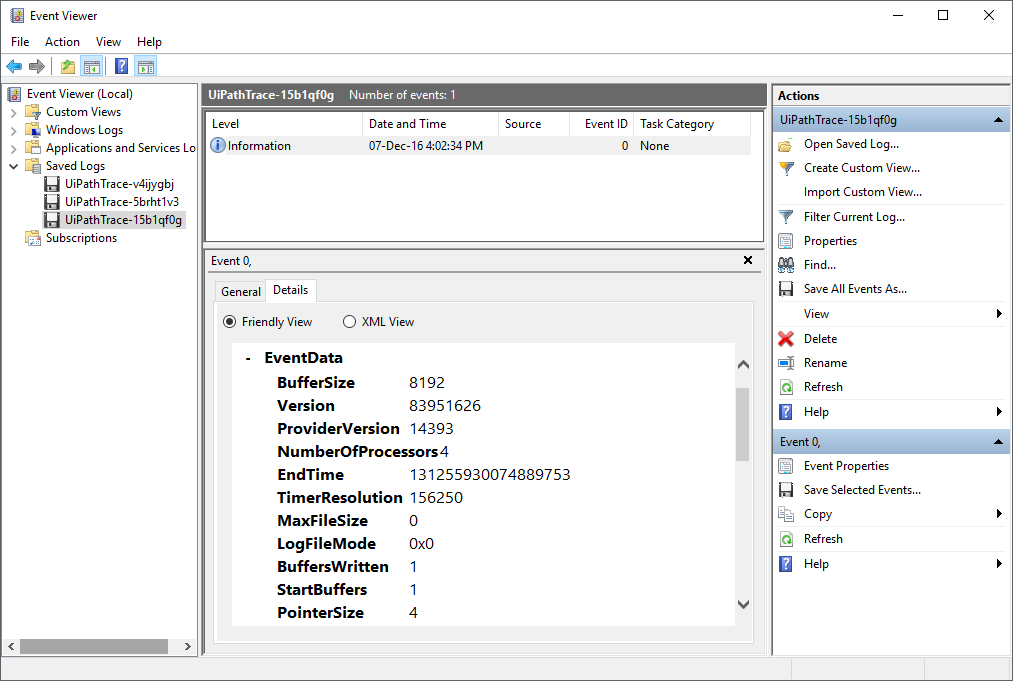
Opening the .etl log file
This type of file can be opened from the Event Viewer:
- In Event Viewer, in the Actions panel, click Open Saved Log. The Open Saved Log window is displayed.
- Browse for the trace log file generated and click Open. The file is displayed in the left panel, under Saved Logs.
- Select the file. Note that the contents of the logs are displayed.

Robot Execution Logs
Robot Execution Logs are messages generated by the execution of a process and typically contain information related to its behavior and user-defined messages.
There are several ways in which execution logs can be generated:
- The Write Line activity creates logs at the Information level.
- The Log Message activity creates logs at the level that is specified in the Level property field.
- Executing an automation project generates logs that contain the behavior of each activity. These logs have the Trace level if the Level setting in the Orchestrator Settings window is set to Verbose.
Execution Logs Logging Level
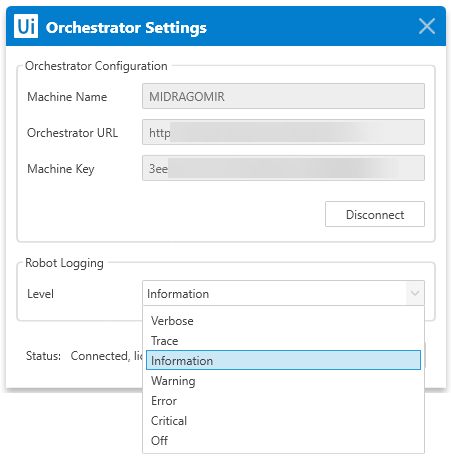
The default logging level is controlled by the Level setting stored in Orchestrator Settings window. By default, it is set to Information.
Changing the Default Logging Level From the Orchestrator Settings Window:
- In the system tray, right-click the
 icon. The Robot settings are displayed.
 - Click the Orchestrator Settings button. The Orchestrator Settings window is opened.
- Select the desired logging level from the Level drop-down menu, under the Robot Logging section.

Note:
If the Service Mode Robot is installed, administrator permission is required to edit this setting.
Targets of the Execution Logs
By default, Execution Logs are stored in a file in the %LocalAppData%\UiPath\Logs folder. The messages are collected by the WorkflowLogging type logger and can be forwarded by using NLog targets, as specified by the following parameters in the NLog.config file:
<target xsi:type="File" name="executionFile" fileName="${LogDirectory}/${shortdate}_Execution.log" layout="${time} ${level} ${message}" concurrentWrites="true" />
<logger name="WorkflowLogging" minLevel="Trace" writeTo="executionFile" final="true" />
If the Robot is connected to Orchestrator, all execution logs are sent to Orchestrator and can be seen in the Logs page.
Additionally, log targets and content can be configured by editing the <Installation Folder>\NLog.config file.
Note:
Editing the
NLog.configfile requires administrator permissions. The Robot service does not need to be restarted for the changes to take effect.
Further Editing of Logs
If the logging level is set to Verbose, the messages contain all the details about the activities that were run at execution. This log output can be customized by editing the UiPath.Executor.exe.config file, which can be found in the C:\Program Files (x86)\UiPath\Studio folder. To do this, XML code must be added under the <system.serviceModel> tag. For example:
<tracking>
    <profiles>
        <trackingProfile name="StandardProfile">
         <workflow>
          <activityStateQueries>
            <activityStateQuery activityName="*">
                <states>
                    <state name="Faulted"/>
                </states>
                <arguments>
                    <argument name="*"/>
                </arguments>
                 <variables>
                    <variable name="*"/>
                </variables>
            </activityStateQuery>
          </activityStateQueries>
         </workflow>
        </trackingProfile>
    </profiles>
</tracking>
Since the <states> tag contains only <state name="Faulted"/>, inserting the above code enables only the activities which have the Faulted state to be logged. Adding other parameters under the <states> tag, such as <state name="Executing"/> causes activities that have other states to be logged as well.
Not only activity states can be modified, but also other things, such as variables and arguments. More information about customization can be found here.
Note:
Modifying the
UiPath.Executor.exe.configfile requires a restart of the Robot service for the changes to take effect.
Updated about a year ago