General View
Displays information about all the existing queues in the current folder on an aggregate basis, and allows you to check the overall health of the queues in your system. On this page, you can control the granularity of the displayed data, to have a more accurate overview of the metrics of your queues.
Filters
- Interval - enables you to control the granularity of the data, and display either the last hour or last day (last 24 hours) of your queues context.
- Include Subfolders - enables you to select if the contents of all subfolders are included. Only available for modern folders.
Note
Filtering impacts all widgets, unless specified otherwise in the dedicated section.
Queues Overview
Allows you to see an overview of the queue's health state so you can assess if there are any problems that would impact the entire system. Each color block represents a specific queue from your instance. Hovering over a block displays the name of the corresponding queue and its containing folder. Note that it is possible to have multiple queues with the same name if each is in a different folder. The total number of queues is displayed in parentheses after the widget name. As a queue's state changes, the chart gets updated and the block color changes accordingly.
The various scenarios are represented with colored blocks and tooltips as follows:
| Color | Tooltip |
|---|---|
| Grey | No changes detected |
| Green | Processing with no issues |
| Orange | Queue items soon overdue |
| Red | Queue items processing failed with application exceptions Queue items overdue |
Clicking a block displays the corresponding detailed view page. Click the arrow at the top-left of the page to return to the general view.
Filtering by Interval does not impact the red blocks in this widget.
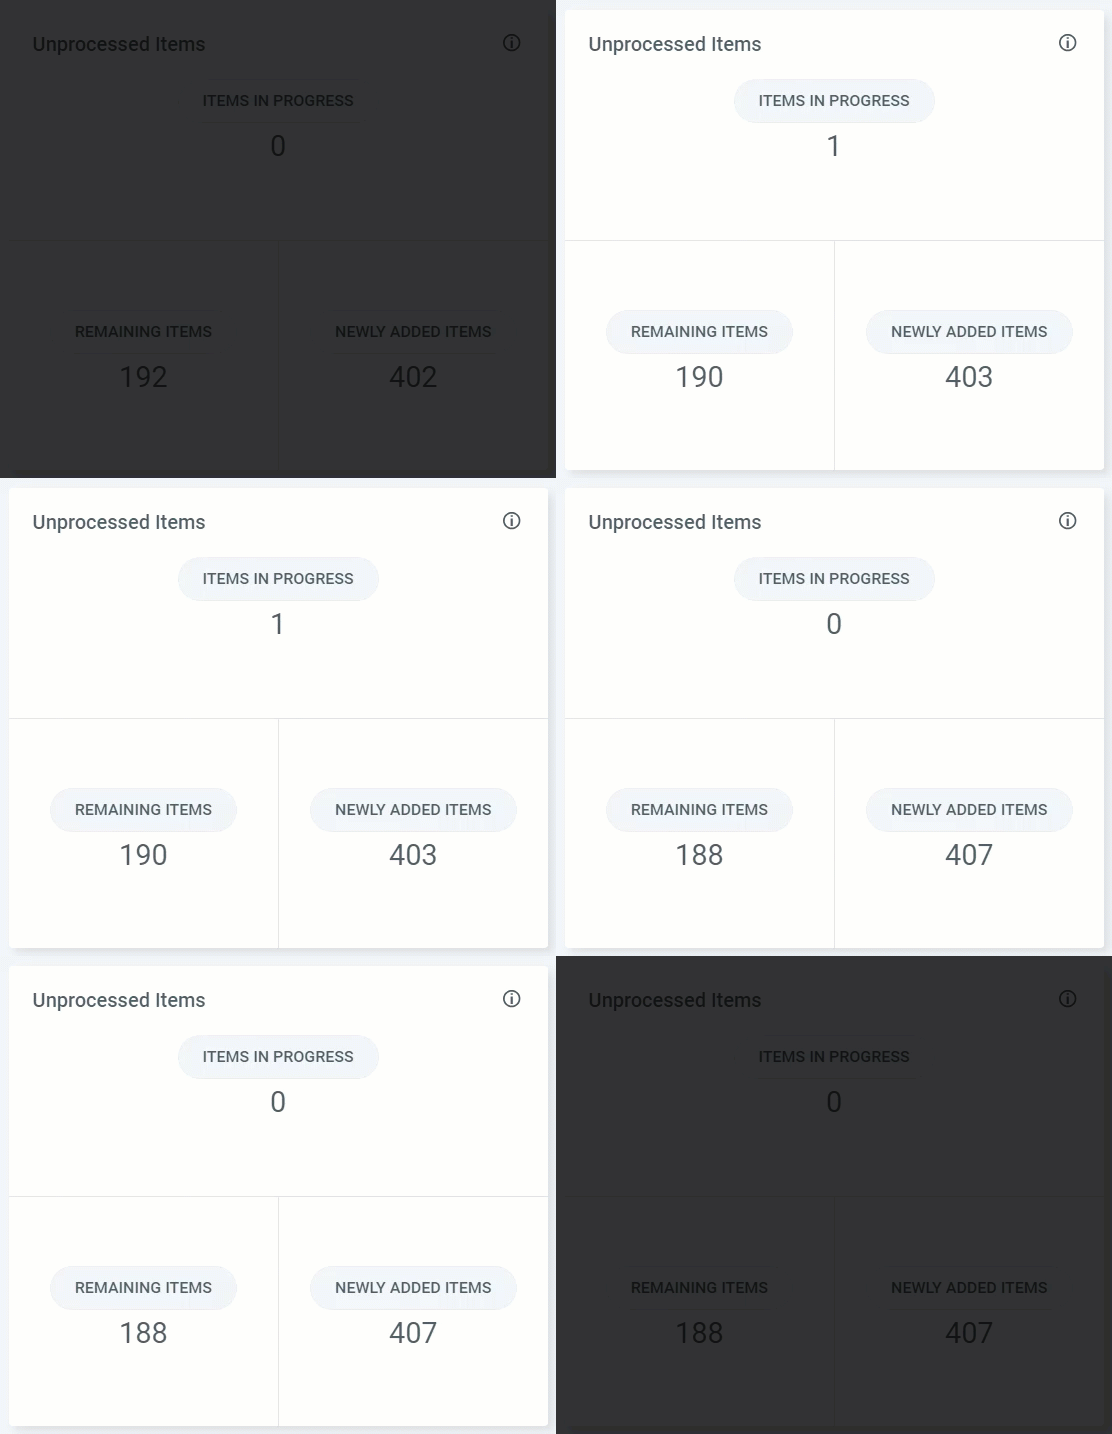
Unprocessed Items
Allows you to see the overall status of all queue items so as to assess if your system is overloaded, and more Robots are needed to process everything in time. Starting an item-processing job causes the Items in Progress section to update accordingly.
The unprocessed queue items are broken down into three categories:
- Newly Added Items - Items that were added in the selected interval regardless of their status.
- Remaining Items - Items remaining to be processed.
- Items in Progress - Items which are in progress.
Filtering by Interval only impacts the Newly Added Items section in this widget.
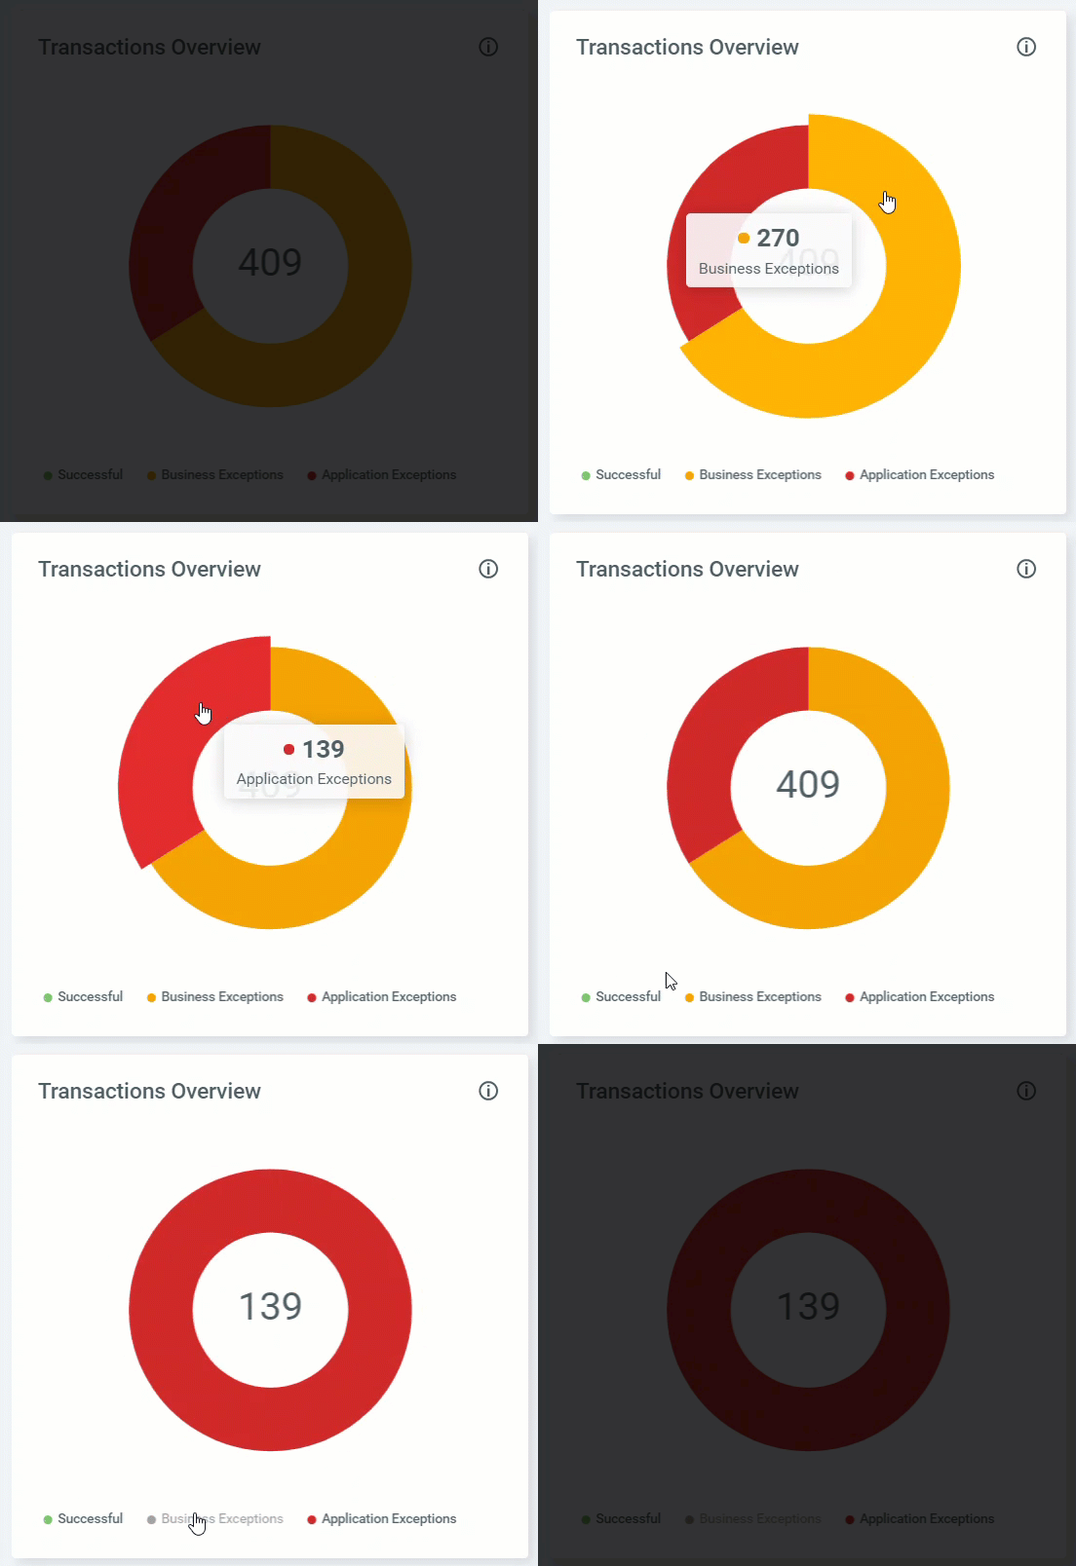
Transactions Overview
Allows you to see precise figures on items that were processed. It enables you to asses whether your queue items are failing or not. Please note that for failed items that were retried, each retry status is taken into account.
Transactions states are represented with colors as follows:
| Color | Tooltip |
|---|---|
| Green | Successful |
| Orange | Business Exceptions |
| Red | Application Exceptions |
The number in the middle of the chart represents the total number of transactions as illustrated by this widget. The number on each slice represents the transactions in that specific state. Once an item is processed, successfully or not, the chart gets updated accordingly. The items are taken into account even if the impacted queue is deleted. You can filter out states by clicking the labels below the chart.
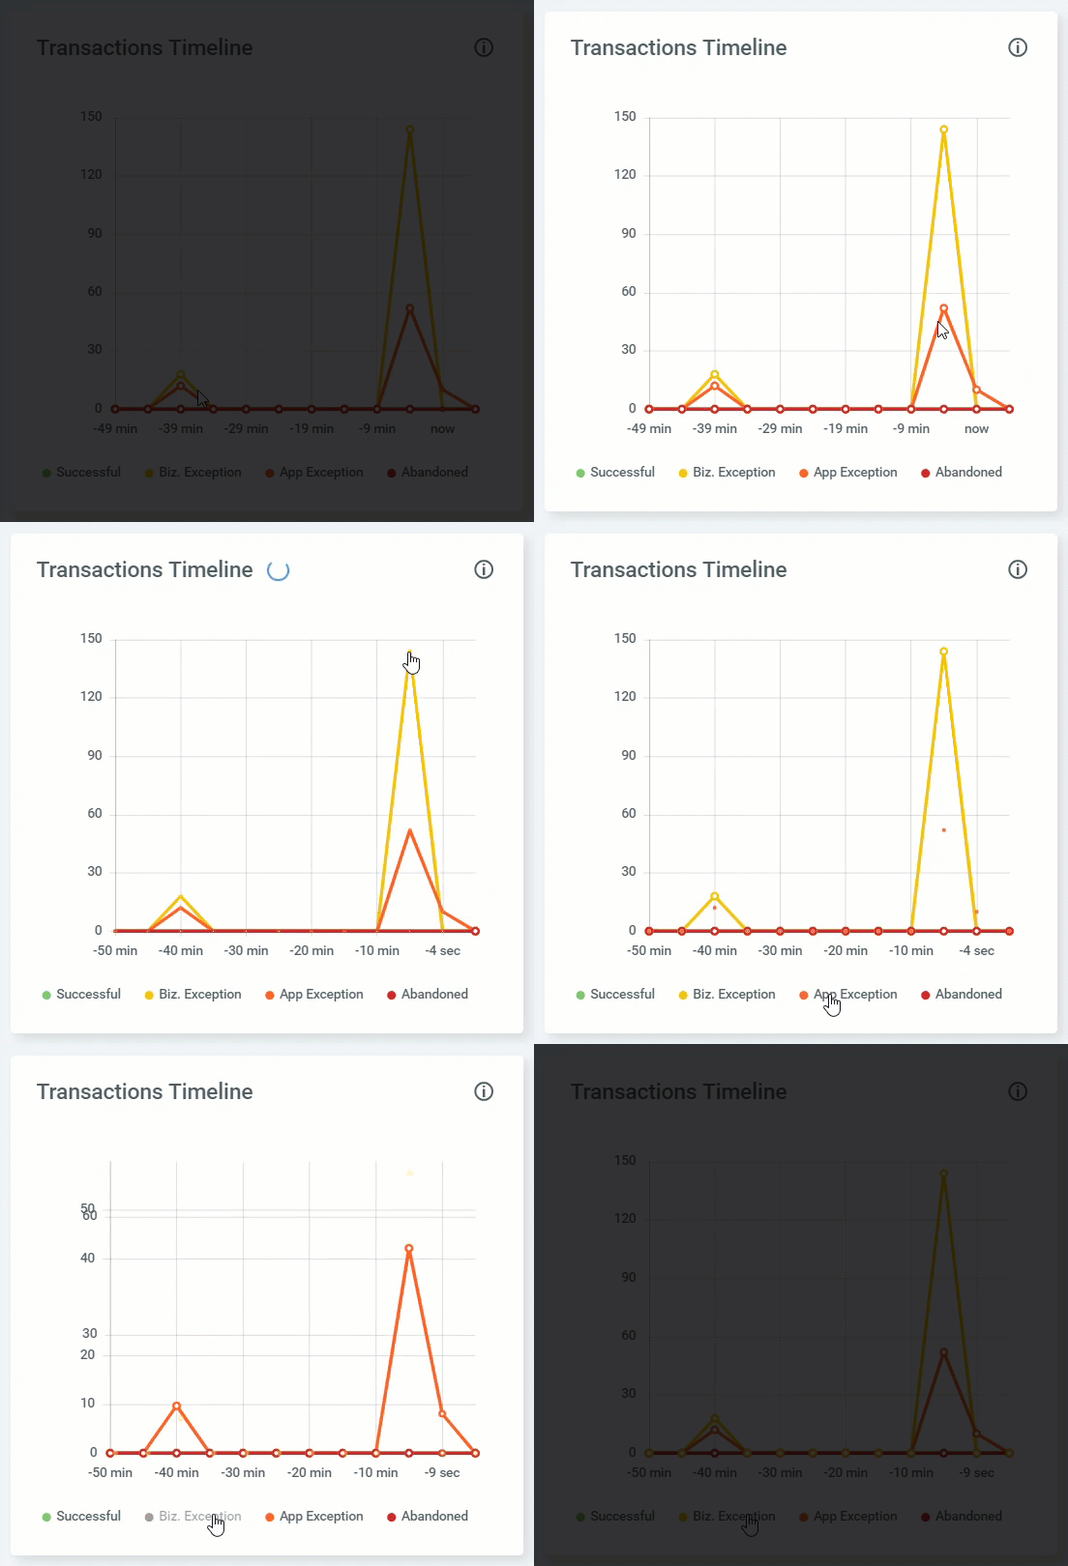
Transactions Timeline
Allows you to see the timeline of processed items broken down according to their final status, in the selected interval. Please note that for failed items that were retried, each retry status is taken into account.
Transaction states are represented with colors as follows:
| Color | Tooltip |
|---|---|
| Green | Successful |
| Yellow | Biz. Exception |
| Orange | App Exception |
| Red | Abandoned |
Once an item-processing job has finished or it has been stopped, the chart gets updated accordingly. Click a marker in the chart to see the exact corresponding value. The items are taken into account even if the impacted queue is deleted. You can filter out states by clicking the labels below the chart.
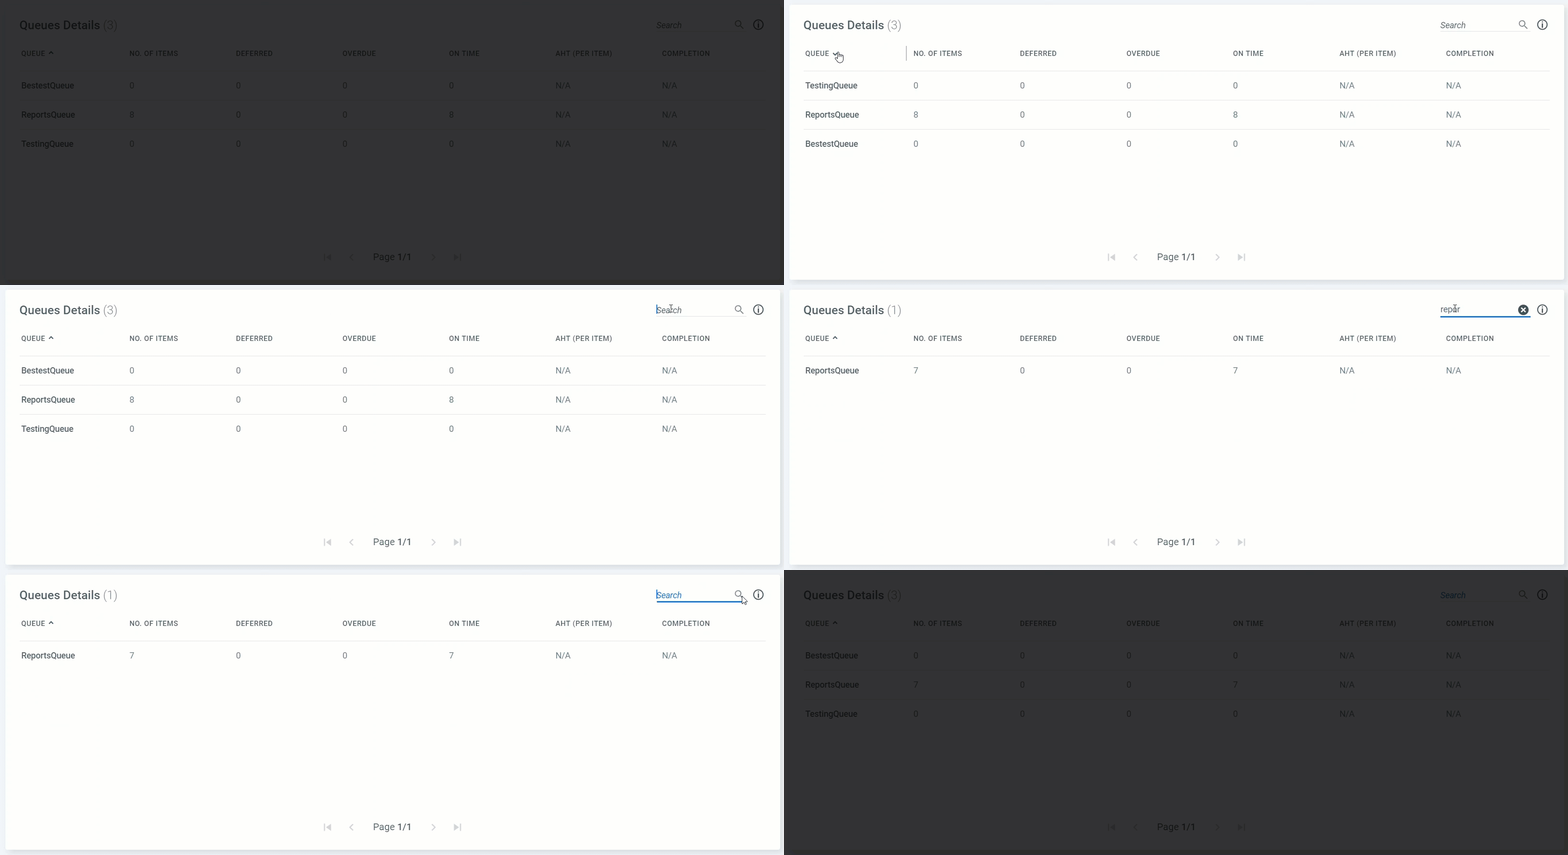
Queues Details
Allows you to see information pertaining to each queue and the corresponding items metrics. The total number of queues is displayed in parentheses after the widget name.
| Field | Description |
|---|---|
| Queue | The name of the queue. Click the arrows at the right of the column name: once to sort data by name, in ascending alphabetical order; twice to sort data by name, in descending alphabetical order. |
| No. of Items | The total number in the queue. It is the same as on the Queues page. |
| Deferred | The number of queue items that have a Postpone date. |
| Overdue | The number of items that have past their established Deadline. |
| On Time | The number of items whose processing falls in the expected estimated time, between the Postpone (if any) and Deadline dates. |
| AHT (Per Item) | The average handling time of a processed item, calculated on all items in the selected queue since it was created. The time is displayed as a rounded-up value. The exact duration in ISO8601 format is shown when you hover over the displayed value. |
| Completion | The estimated completion time for the rest of the items based on the average handling time. |
| Folder | The folder where the Queue is located. |
| Search | Enables you to search by queue name. |
Filtering by Interval does not impact this widget.
Individual View
Displays information concerning one queue, as selected by the user from the general view, specifically on the Queues Overview widget. Each widget in this view contains the exact same information as on the Queues page. Changing the properties there automatically causes the information here to update accordingly.
Filters
Interval - allows you to control the granularity of the data, and display either the last hour or last day (last 24 hours) of the selected queue's health state.
Transactions Overview
Allows you to see precise figures on items that were processed in the selected queue. It provides metrics about the encountered exceptions so that you can asses whether your queue items are failing or not. Please note that for failed items that were retried, each retry status is taken into account.
Transaction states are represented with colors as follows:
| Color | Tooltip |
|---|---|
| Green | Successful |
| Orange | Business Exceptions |
| Red | Application Exceptions |
The number in the middle of the chart represents the total number of transactions as illustrated by this widget. Once an item is processed, successfully or not, the chart gets updated accordingly. You can filter out states by clicking the labels below the chart.
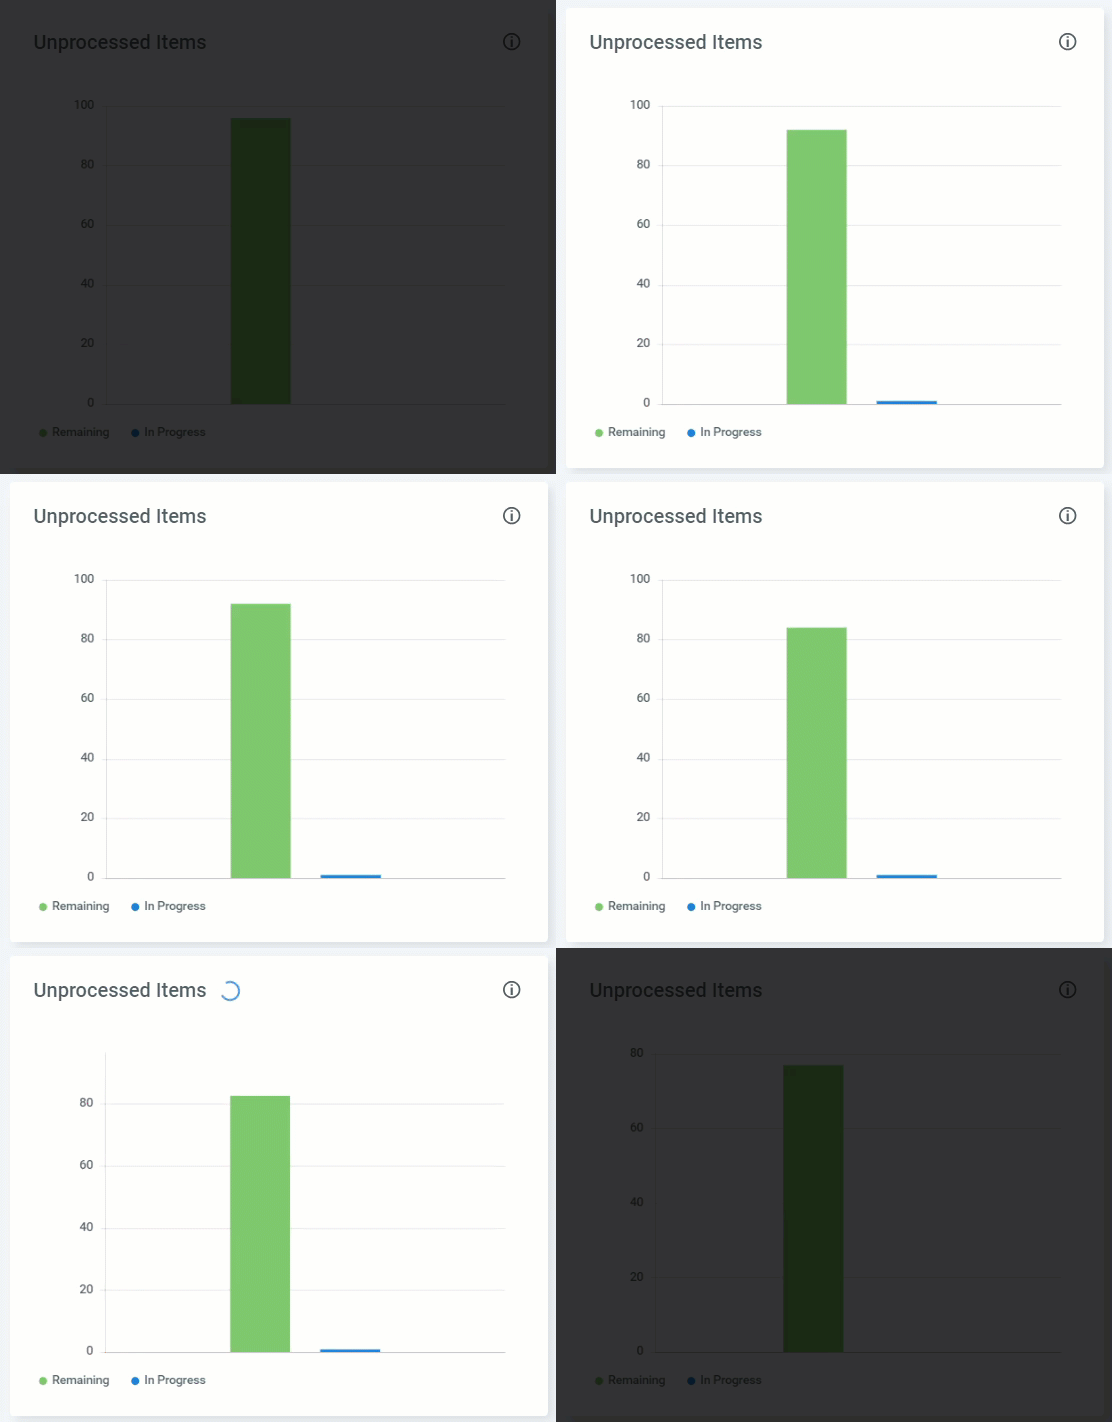
Unprocessed Items
Allows you to see unprocessed items in a queue broken down into two categories:
- Items remaining to be processed
- Items which are in progress.
This enables you to see the overall status of all the items in a queue so as to assess if your system is overloaded, and more Robots are needed to process everything in time. Starting an item-processing job causes the Items in Progress section to update accordingly. You can filter out states by clicking the labels below the chart.
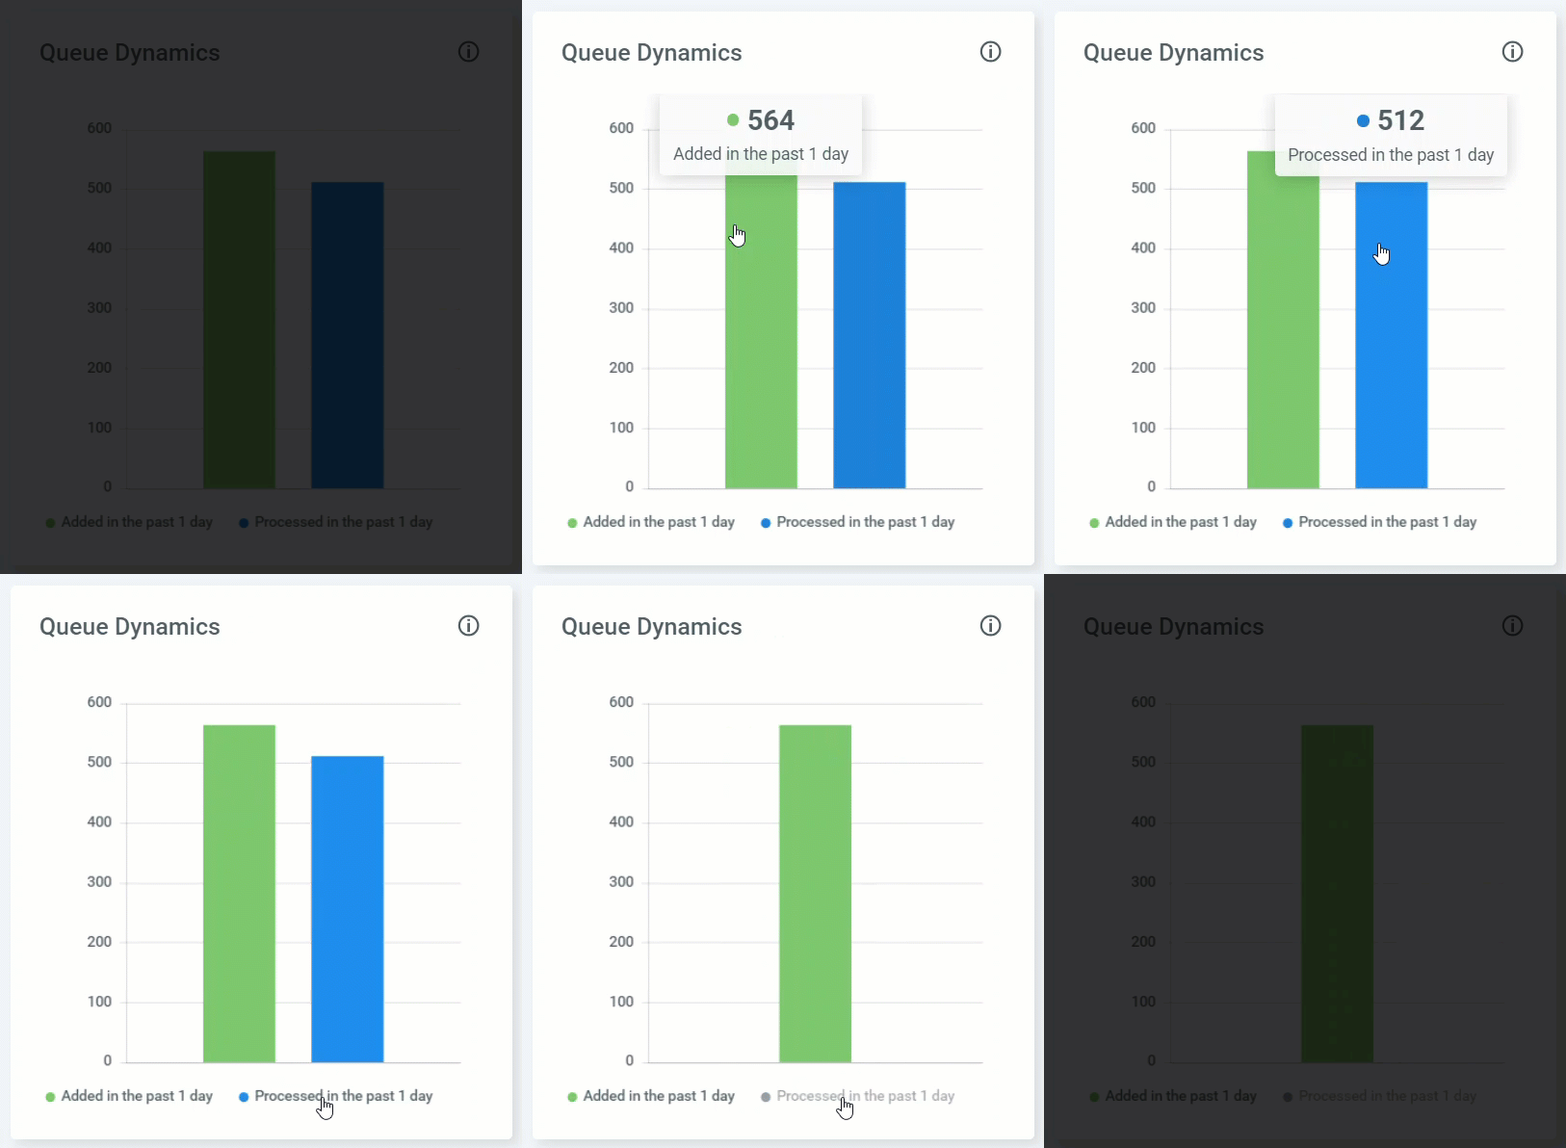
Queue Dynamics
Allows you to see the number of items in the selected queue that were either added or processed, in the selected interval, thus enabling you to assess the efficiency of your system concerning item processing. You can filter out states by clicking the labels below the chart.
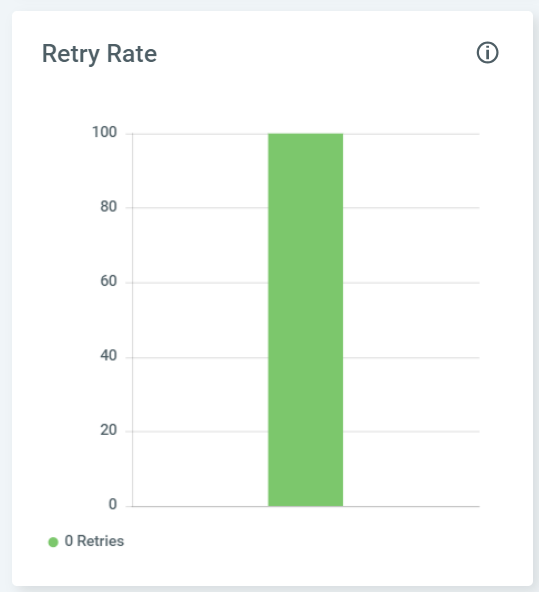
Retry Rate
Enables you to see your successfully processed queue items broken down according to the number of retries. The number of retries for successfully executed items are also taken into account in this widget. You can filter out states by clicking the labels below the chart.
Transactions Timeline
Allows you to see the timeline of processed items in the selected queue, broken down according to their final status, in the selected interval. Please note that for failed items that were retried, each retry status is taken into account.
Transaction states are represented with colors as follows:
| Color | Tooltip |
|---|---|
| Green | Successful |
| Yellow | Biz. Exception |
| Orange | App Exception |
| Red | Abandoned |
Once an item-processing job has finished or has been stopped, the chart gets updated accordingly. Click a marker in the chart to see the exact corresponding value. The items are taken into account even if the impacted queue is deleted. You can filter out states by clicking the labels below the chart.
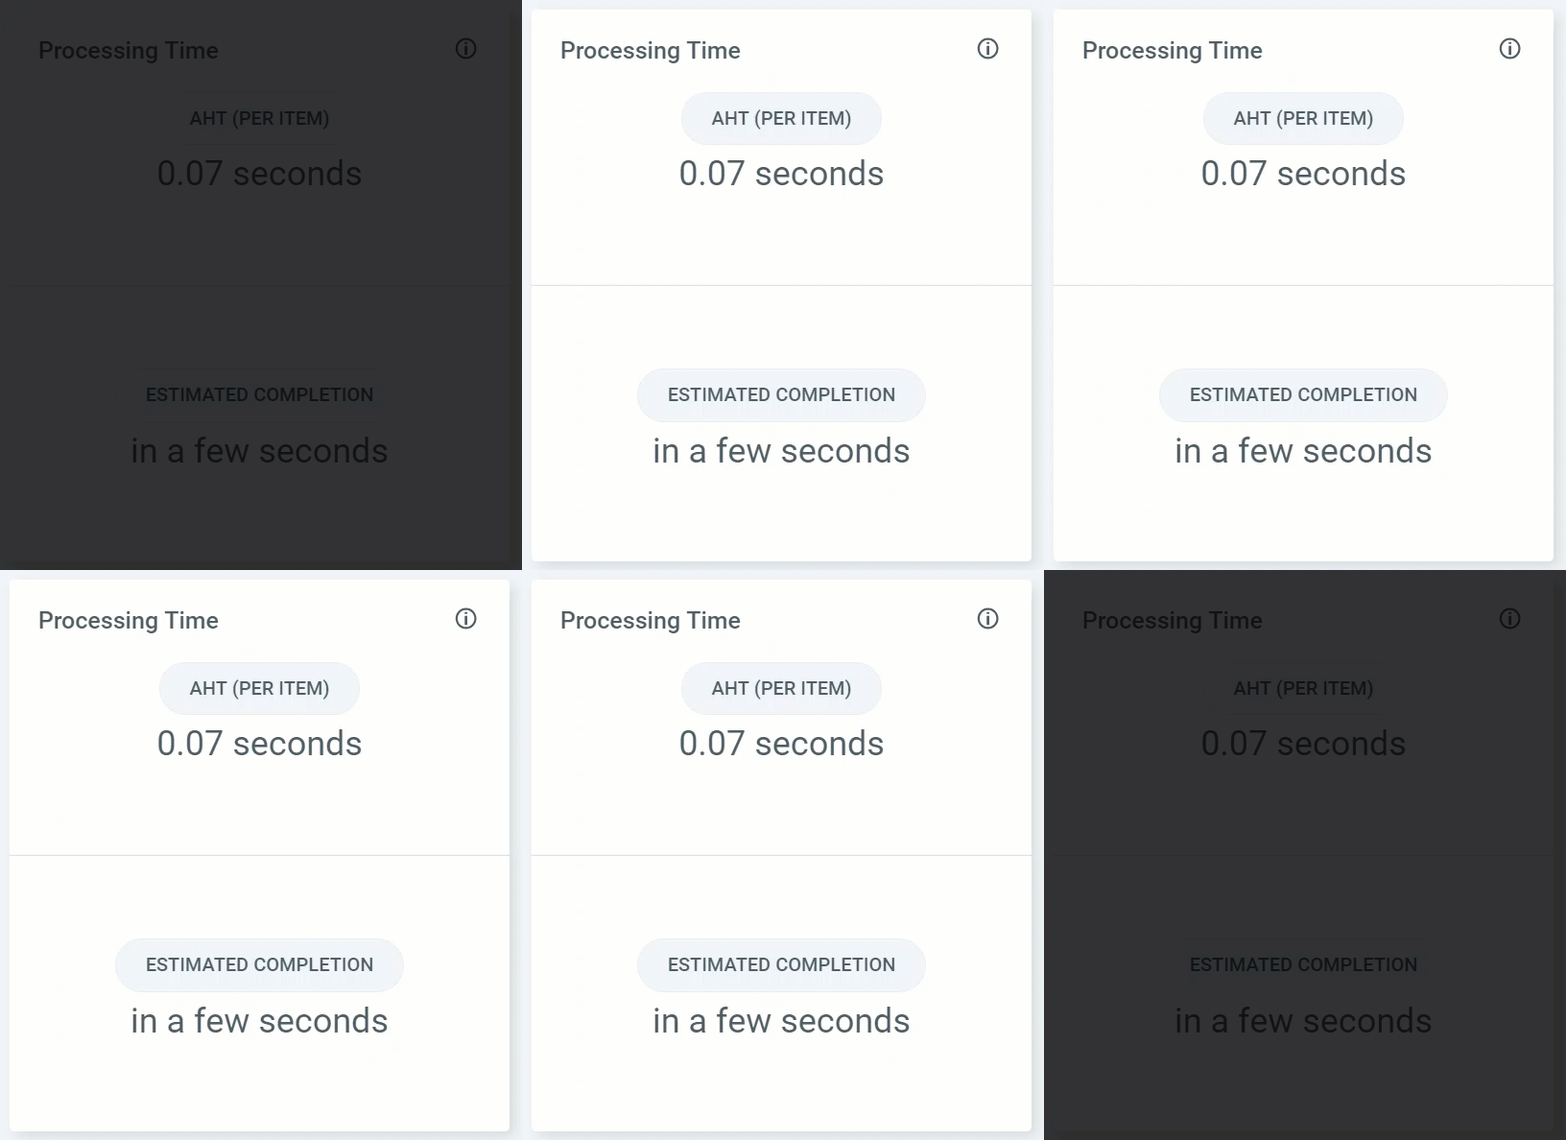
Processing Time
Enables you to see the average handling time of an item, calculated on all items in the selected queue since it was created, and the estimated completion time for the rest of the items based on that average. The Estimated Completion value is influenced by the number of Robots which are currently processing items, as well as by items that have a Defer Date. When no more unprocessed items are left in the queue, the value is set to N/A.
Filtering by Interval does not impact this widget.
Note that the durations are displayed as rounded-up values. The exact duration in ISO8601 format is shown when you hover over the displayed value.
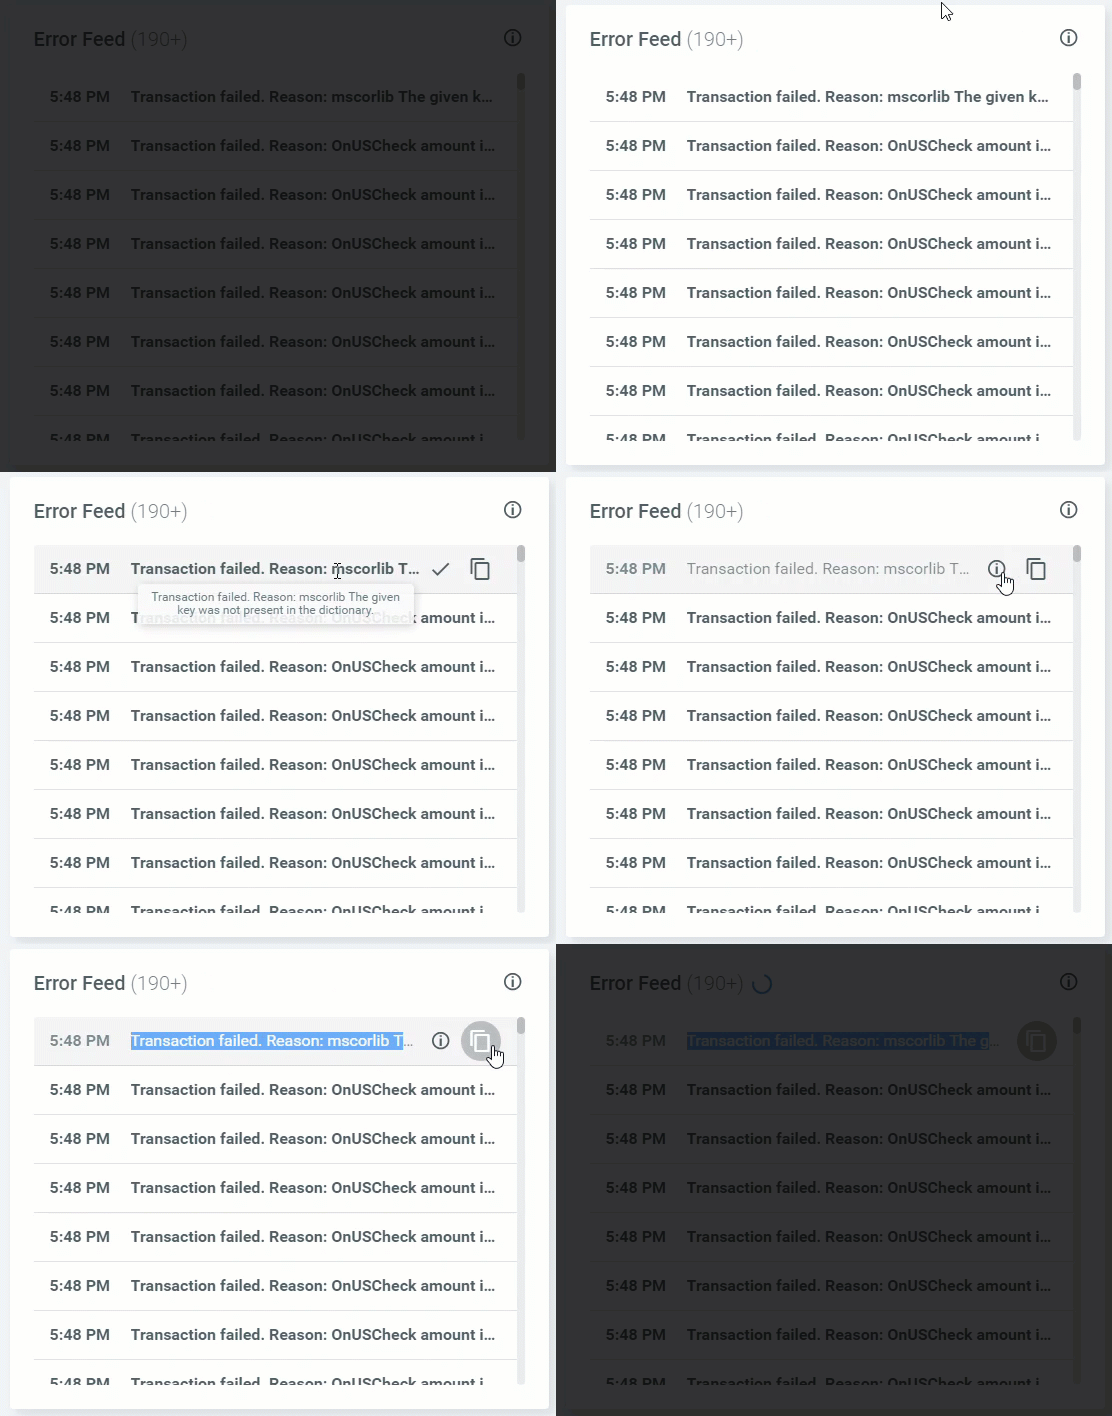
Error Feed
Allows you to see the a list of the errors encountered on the selected queue. The errors are displayed in reverse chronological order as they occur, meaning a new error is always displayed at the top of the feed. The number of errors displayed in parentheses after the widget name is expressed according to your position within the feed and to the total number of errors. Let's say there are 453 errors in your feed. The following behavior is encountered:
| Position Within the Feed | Displayed Value |
|---|---|
| Between 0 and 99 | 99+ |
| Between 100 and 199 | 199+ |
| Between 200 and 299 | 299+ |
| Between 300 and 399 | 399+ |
| Further than 400 | The total number of errors in the feed, in this particular example 453. |
After reaching the end of the feed, the total number of errors is displayed regardless of your position.
You can dismiss an error after having acknowledged it, however please take into account that multiple users might check the feed simultaneously, so we recommend carefully using the Dismiss button. A dismissed error is still taken into account in the error counter. After an error was dismissed, the name of the user who performed the action is displayed adjacently in a tooltip. Note that you need Edit permissions on Monitoring to dismiss errors. Details here.
| Field | Description |
|---|---|
| Time | The time when the error occurred. |
| Error Message | The actual error message. |
| Dismiss | Enables you to dismiss the specific error message. Clicking the Dismiss button removes the formatting from the text. A dismissed error is still taken into account in the error counter. After an error was dismissed, the name of the user who performed the action is displayed adjacently. Note that you need Edit Permissions on Monitoring in order to dismiss errors. Details here. |
| Copy | Enables you to copy the text of the error message to the clipboard. |
Updated 2 years ago

