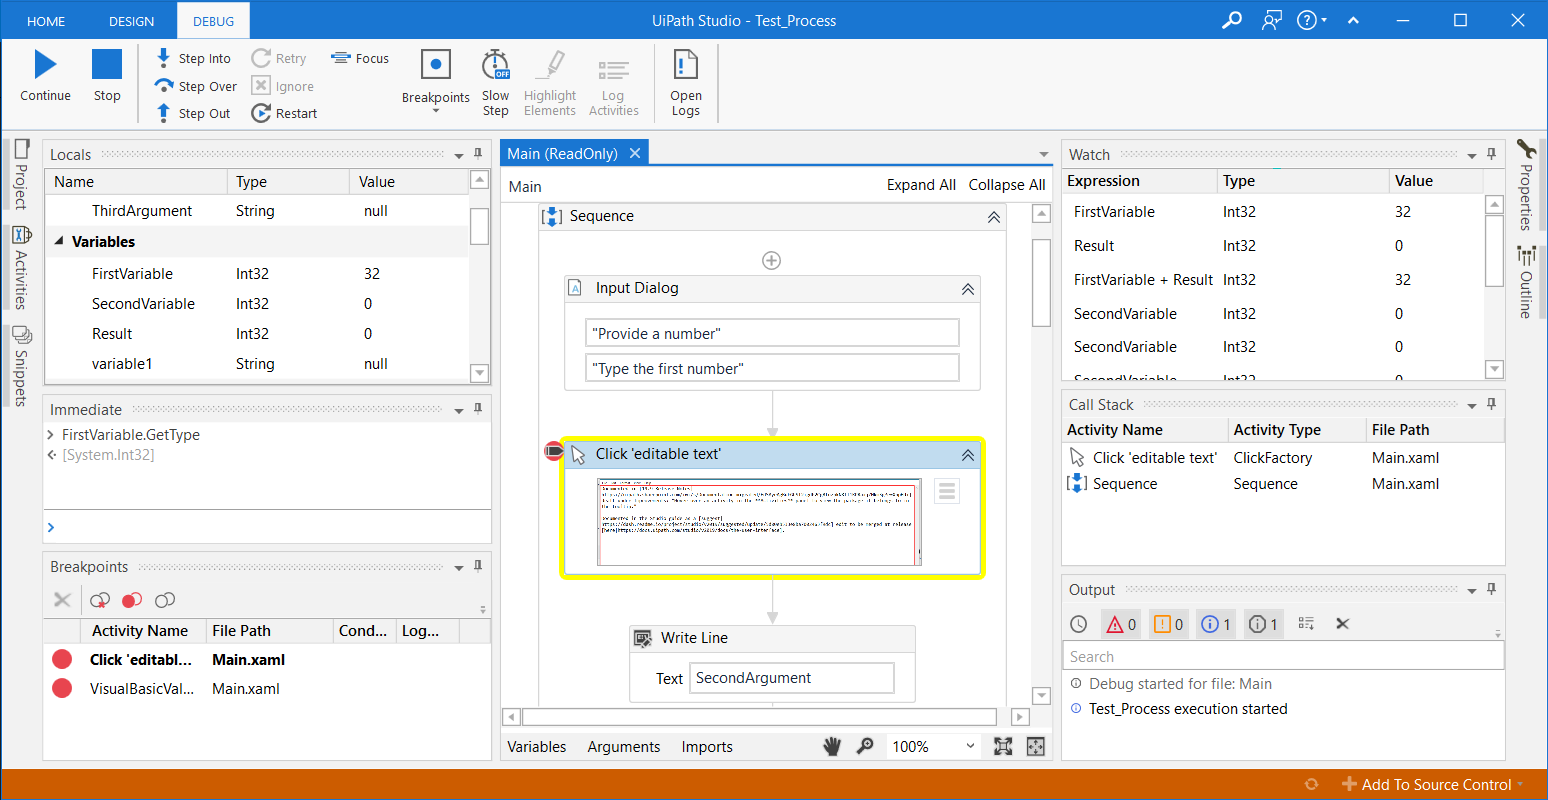
Debugging is the process of identifying and removing errors that prevent the project from functioning correctly. It is recommended to perform debugging during the design stage of the automation project, at activity, file and project level.
Debugging can be performed using several options, defined in the ribbon and explained in the Debugging Actions page.
Several panels make it easier to view the debugging process, add values or monitor variables and arguments.

Start Debugging
The options for running and debugging a file or project are available both in the Design and Debug tabs.
| Option | Description |
|---|---|
| Debug | Click Debug or use F5 to debug the whole project. |
| Run | Click Run or use Ctrl + F5 to run the whole project. |
| Debug File | Click Debug File or use F6 to debug the current file. |
| Run File | Click Run File or use Ctrl + F6 to run the current file. |
During debug, click the Break button to pause. The activity which is being debugged remains highlighted when paused. Once this happens, you can choose other debug actions like Step Into or press Stop to exit and return to design mode. The keyboard shortcut for the Stop button is F12.
It is recommended to use Break along with Slow Step so that you know exactly when debugging needs to be paused.
The Continue option is available when the debug process is paused.
Updated 3 years ago