Debugging of a single file or the whole project can be performed both from the Design or Debug ribbon tabs. However, the debugging process is not available if project files have validation errors.

Step Into
Use Step Into to debug activities one at a time. When this action is triggered, the debugger opens and highlights the activity before it is executed.
When Step Into is used with Invoke Workflow File activities, the workflow is opened in a new tab in ReadOnly mode and each activity is executed one by one.
The keyboard shortcut for Step Into is F11.
Step Over
Unlike the Step Into action, Step Over does not open the current container. When used, the action debugs the next activity, highlighting containers (such as flowcharts, sequences, or Invoke Workflow File activities) without opening them.
This action comes in handy for skipping analysis of large containers which are unlikely to trigger any issues during execution.
Step Over is available using the F10 keyboard shortcut.
Step Out
As the name suggests, this action is used for stepping out and pausing the execution at the level of the current container. Step Out completes the execution of activities in the current container, before pausing the debugging. This option works well with nested sequences.
Step Out is available using the Shift + F11 keyboard shortcut.
Retry
Retry re-executes the previous activity, and throws the exception if it's encountered again. The activity which threw the exception is highlighted and details about the error are shown in the Locals and Call Stack panels.
Ignore
The Ignore action can be used to ignore an encountered exception and continue the execution from the next activity so that the rest of the workflow can be debugged.
This action is useful when jumping over the activity that threw the exception and continuing debugging the remaining part of the project.
Restart
Restart is available after an exception was thrown and the debug process is paused. The action is used for restarting the debugging process from the first activity of the project. Use Slow Step to slow down the debugging speed and properly inspect activities as they are executed.
Please take into consideration that when using this option after using the Run from this Activity action, the debugging is restarted from the previously indicated activity.
Break
Break allows you to pause the debugging process at any given moment. The activity which is being debugged remains highlighted when paused. Once this happens, you can choose to Continue, Step Into, Step Over, or Stop the debugging process.
It is recommended to use Break along with Slow Step so that you know exactly when debugging needs to be paused.
An alternative to using Slow Step in this situation is to keep an eye on the Output panel and use Break on the activity that is currently being debugged.
Focus
Focus Execution Point helps you return to the current breakpoint or the activity that caused an error during debugging. The Focus button is used after navigating through the process, as an easy way to return to the activity that caused the error and resume the debugging process.
Alternatively, when debugging is paused because a breakpoint was reached, Focus can be used for returning to said breakpoint, after navigating through activities contained in the automation process.
A third case is when the debugging is paused either after using Step Into or Step Over and then navigating through the process. In this case, Focus returns to the activity that paused the debugging process.
From the Breakpoints context menu, you can select Focus to highlight the activity with the breakpoint.
Slow Step
Slow Step enables you to take a closer look at any activity during debugging. While this action is enabled, activities are highlighted in the debugging process. Moreover, containers such as flowcharts, sequences, or Invoke Workflow File activities are opened. This is similar to using Step Into, but without having to pause the debugging process.
Slow Step can be activated both before or during the debugging process. Activating the action does not pause debugging.
Although called Slow Step, the action comes with 4 different speeds. The selected speed step runs the debugging process slower than the previous one. For example, debugging with Slow Step at 1x runs it the slowest, and fastest at 4x. In other words, the speed dictates how fast the debugger jumps from one activity to the next.
Each time you click Slow Step the speed changes by one step. You can easily tell by the icon, which updates accordingly.
Highlight Elements
If enabled, UI elements are highlighted during debugging. The option can be used both with regular and step-by-step debugging.
Log Activities
If enabled, debugged activities are displayed as Trace logs in the Output panel. Note that Highlight Elements and Log Activities options can only be toggled before debugging, and persist when reopening the automation project. This is not applicable for invoked workflows unless these files are opened in the Designer panel.
Logs are automatically sent to Orchestrator if connected, but you can have them stored locally by disabling the Allow Development Logging option from the Settings tab in the Add or Edit Robot window.
Disabling Log Activities can be a way to send smaller log files to Orchestrator.
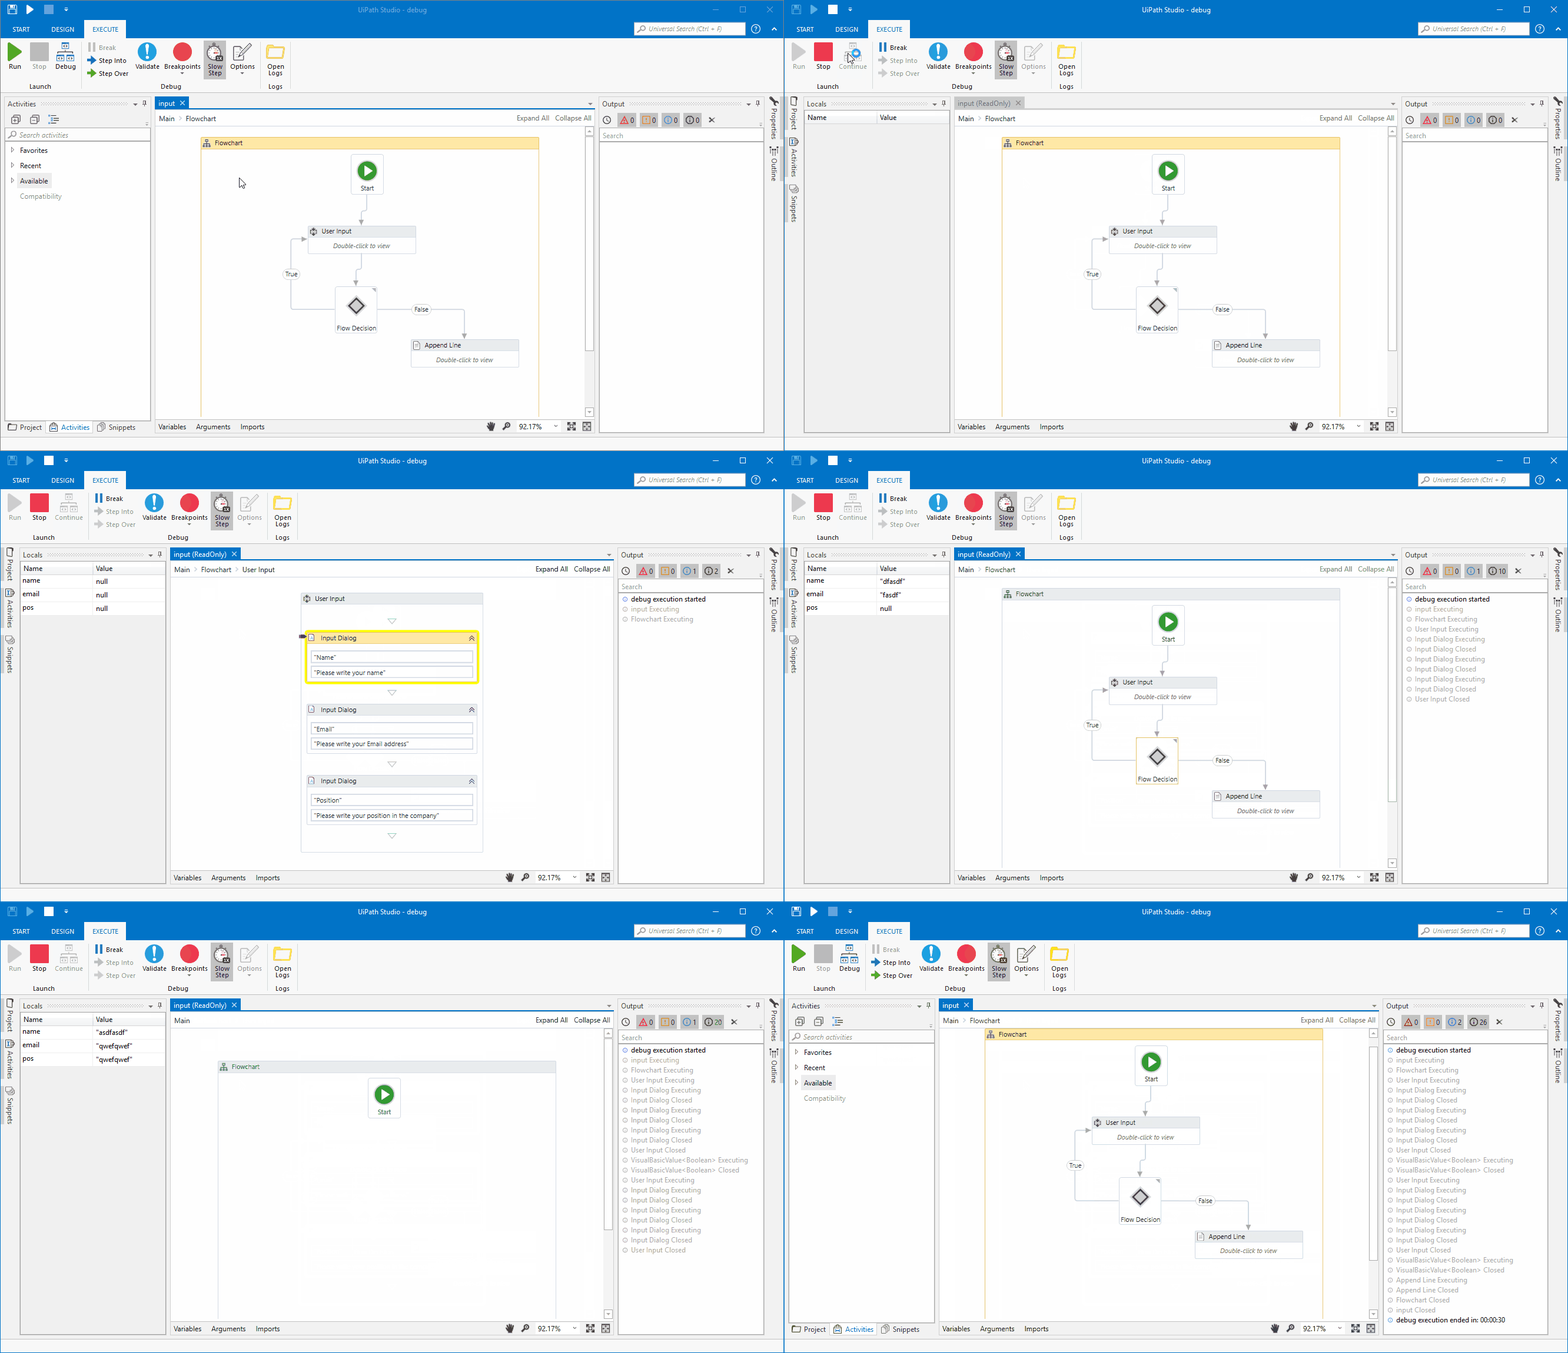
By default, the debugger logs activities so that each step appears in the Output panel. We recommend leaving it enabled for easier tracing, as you can see in the image below:

The issue here is that one or more input fields from the User Input sequence are blank, which is a True condition for the Flow Decision. You can tell this by the fact that, during debugging, the User Input sequence is executed twice, meaning that one or more fields were left blank during the first execution.
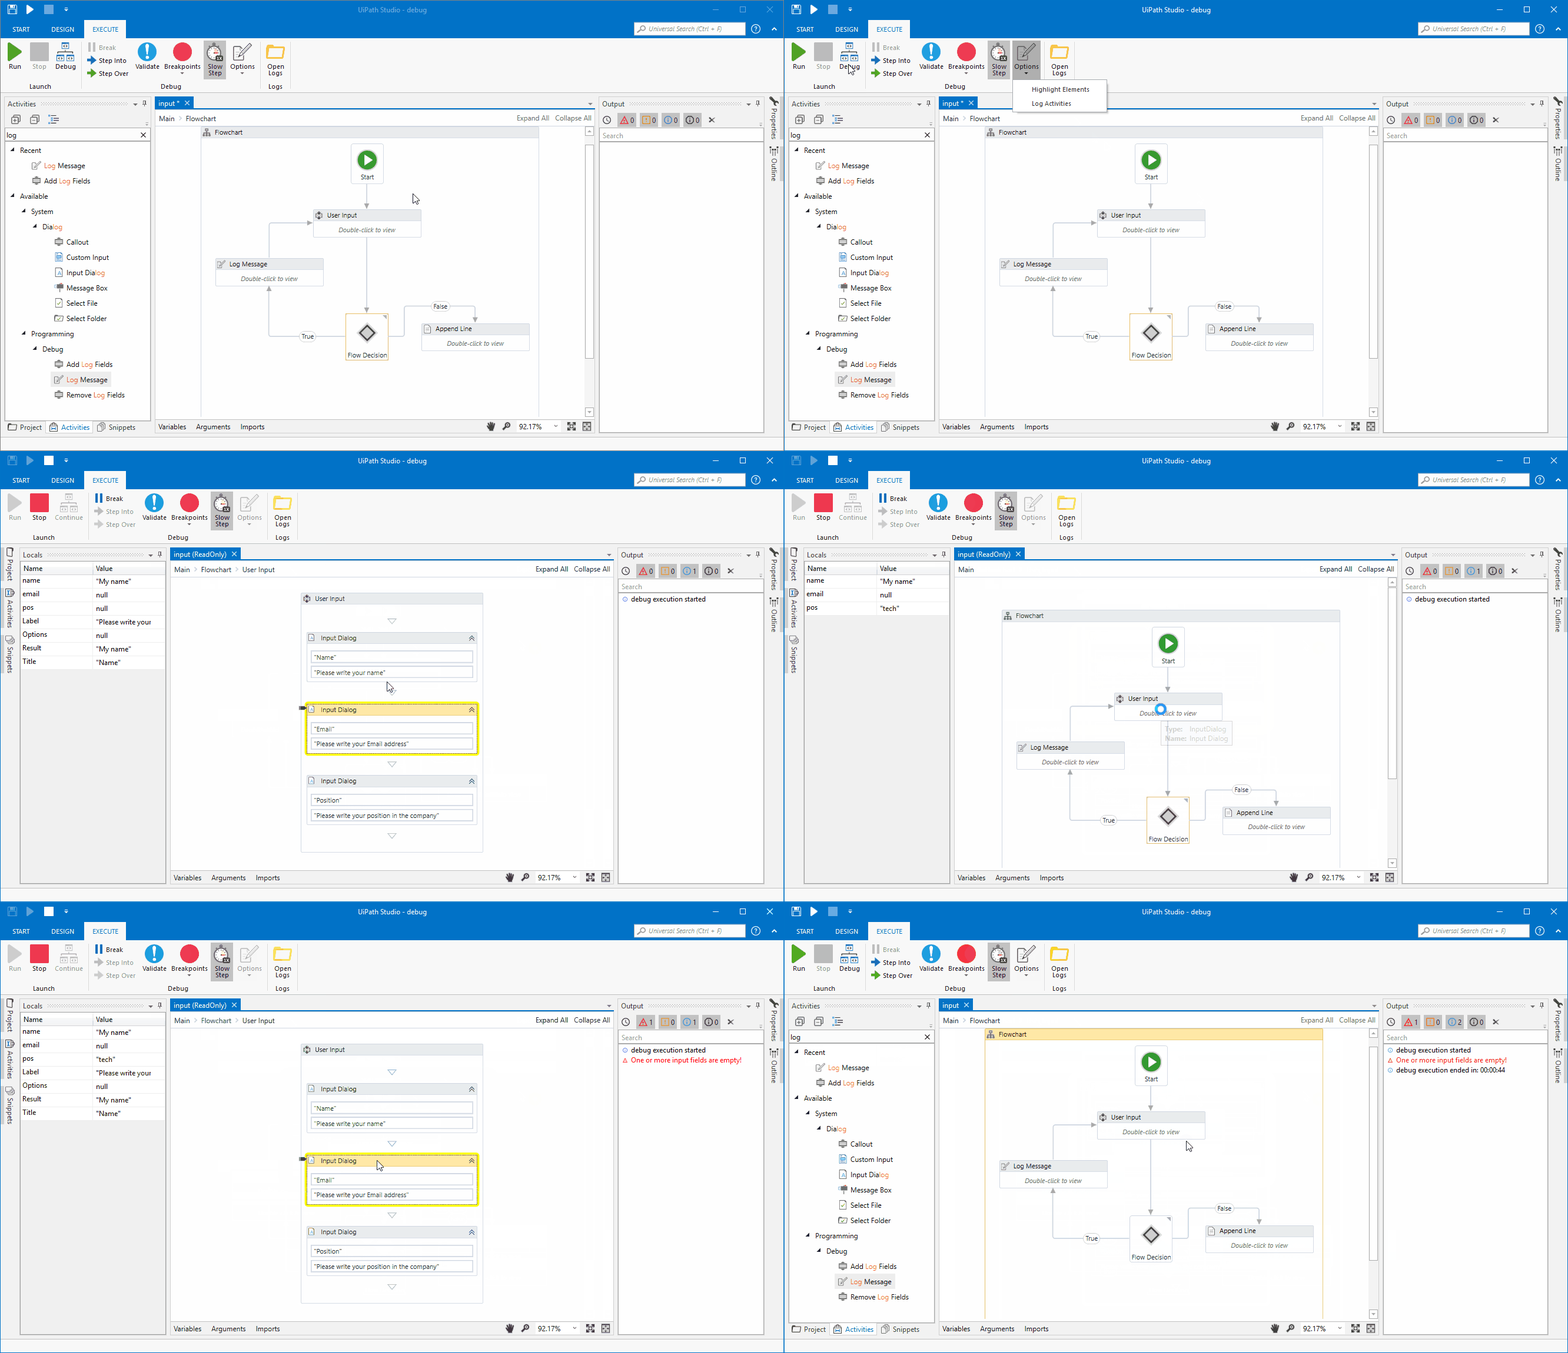
If you decide to disable the Log Activities option for debugging, Trace logs are not displayed in the Output panel. In the case of a normal execution with no errors, you only get to see the debug execution start and end times. However, adding a Log Message can help you determine where issues might occur.
For example, you can add a Log Message activity to inform you that, in this case, one or more input fields are empty. This message appears in the Output panel during debugging, even if the Log Activities option is disabled, as you can see below:

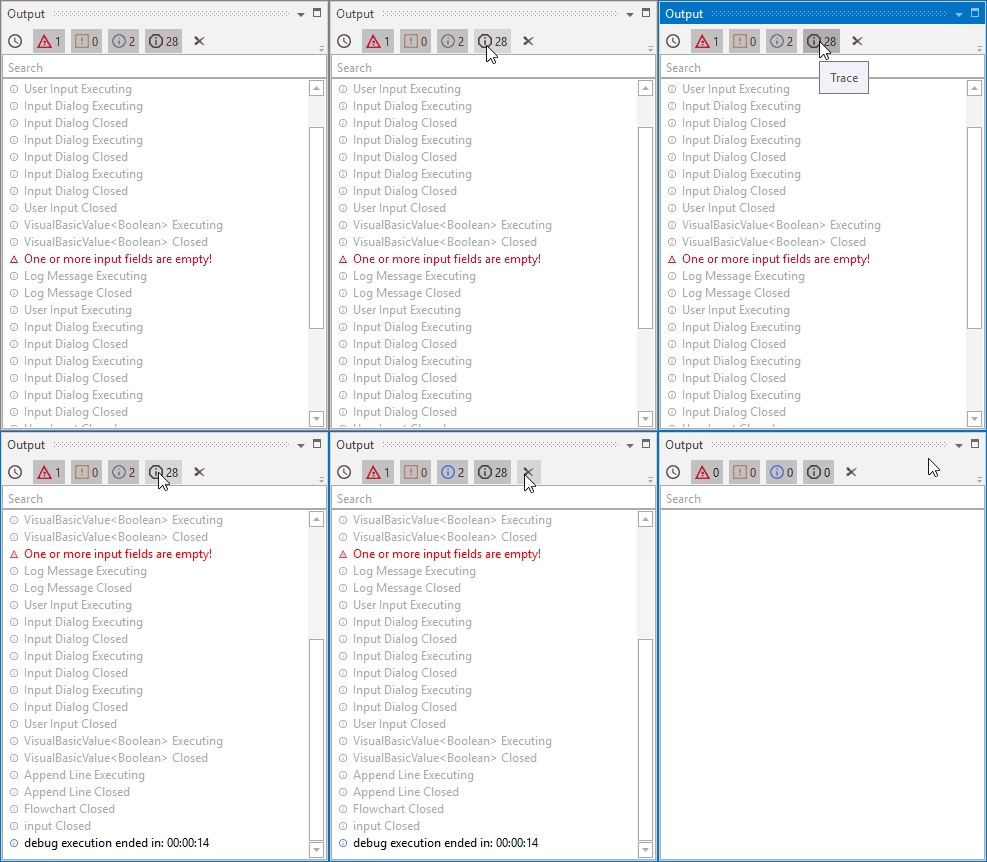
Remember that you can always filter the messages displayed in the Output panel by simply selecting the alert types of interest, or even clear all messages.

Note that by default all debugging logs are sent to Orchestrator. You can disable this by clearing the Allow Development Logging option from the Settings tab in the Add or Edit Robot window. If this option is disabled, debugging logs are only stored locally.
Open Logs
Clicking Open Logs brings up the %localappdata%\UiPath\Logs folder where logs are locally stored. The naming format of log files is YYYY-DD-MM_Component.log (such as 2018-09-12_Execution.log, or 2018-09-12_Studio.log). Read more about logging here.
Updated 5 months ago