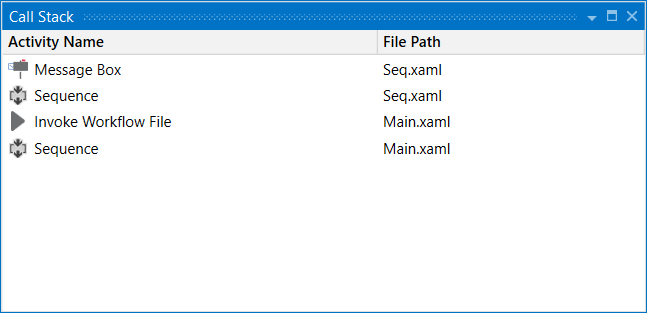
The Call Stack panel displays the next activity to be executed and its parent containers when the project is paused in debugging.
The panel is displayed during execution in debug mode and it gets populated after using Step Into, Break, Slow Step, or after the execution was paused because an error or a breakpoint was encountered.

Double-clicking an item in the Call Stack panel, focuses and highlights the selected activity in the Designer panel.
If during debugging, an activity throws an exception, it is marked in the Call Stack panel and the activity is highlighted in red.
Updated 3 years ago